

Who can do this: A job profile’s Dashboard tab needs access to that job profile. The company versions need Company Dashboard Access. Seeing the employees behind the charts needs Performance Access. Recording a separation needs access to the employee’s record; the Employees page needs All Employee Access.
Where the data comes from
Quality of hire reporting reads your employee records: each employee’s job, Start Date, End Date and Separation Reason, plus their performance results.
If your HR system is connected and its employee sync is on, an employee who’s terminated in your HR system gets an end date in Journeyfront on the next sync, with a separation reason: the one mapped from your HR system, or a general one when your HR system doesn’t send a reason. See HRIS integrations.
Imports are under Settings, then Import Data. See Importing data.
Record that an employee left
1
Open the employee
Click Employees in the top navigation and select the employee.
2
Open Job Info
Click the Job Info tab.
3
Mark that they no longer work here
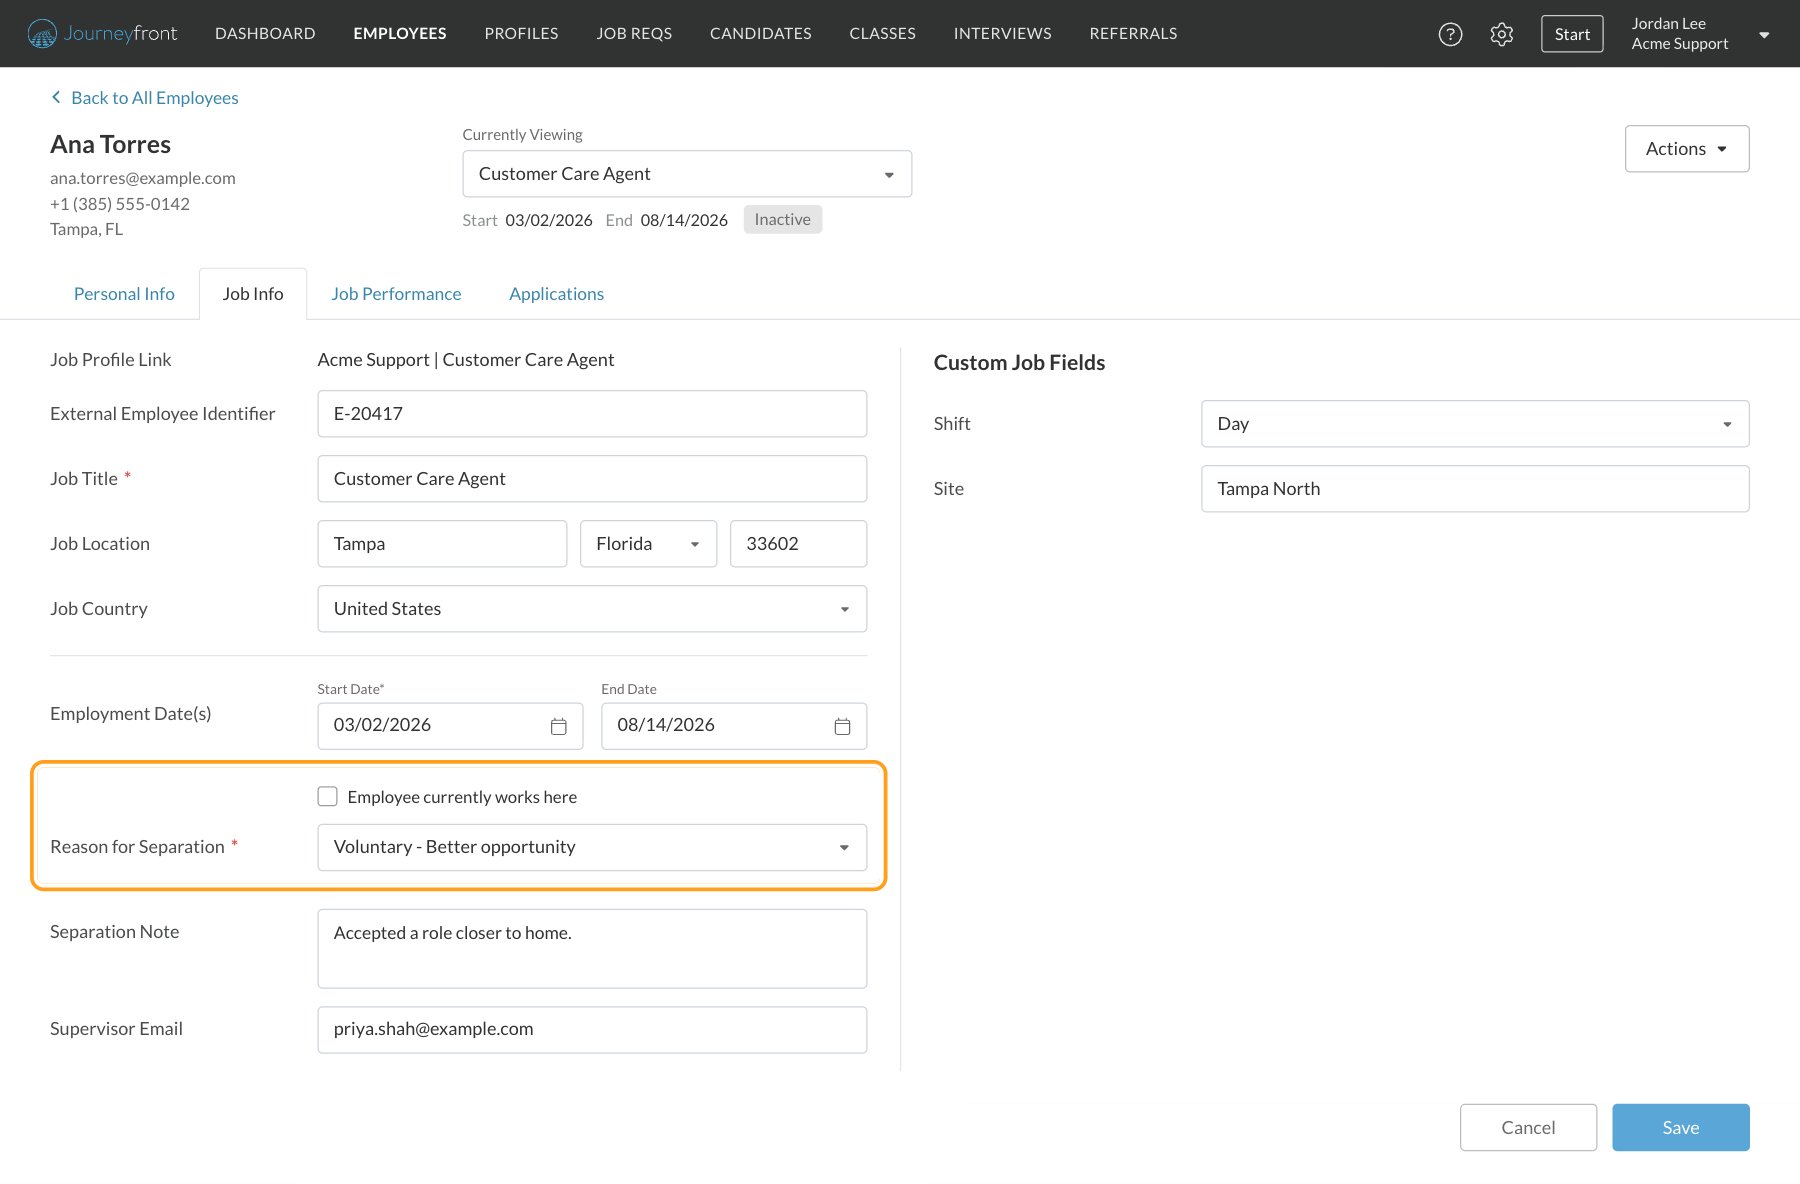
Untick Employee currently works here and enter the End Date.
4
Add the reason
Choose a Reason for Separation (required) and add a Separation Note if it helps.
5
Save
Click Save. Turnover reporting includes the change.
Open a job profile’s Dashboard
Quality of hire reads best one role at a time, because what makes a great customer care associate isn’t what makes a great collections agent. Click Profiles in the top navigation, open the job profile and click its Dashboard tab. Then pick a view: Attributes, Activities, Interview Questions, Interviewers, Turnover or Performance. See Job profiles.Turnover
Turnover shows when and how fast your hires leave. Set From date and To date, choose Month, Qtr, 6 Mo or Year, and filter by Separation Reason or by a multiple-choice employee job field with Job Field.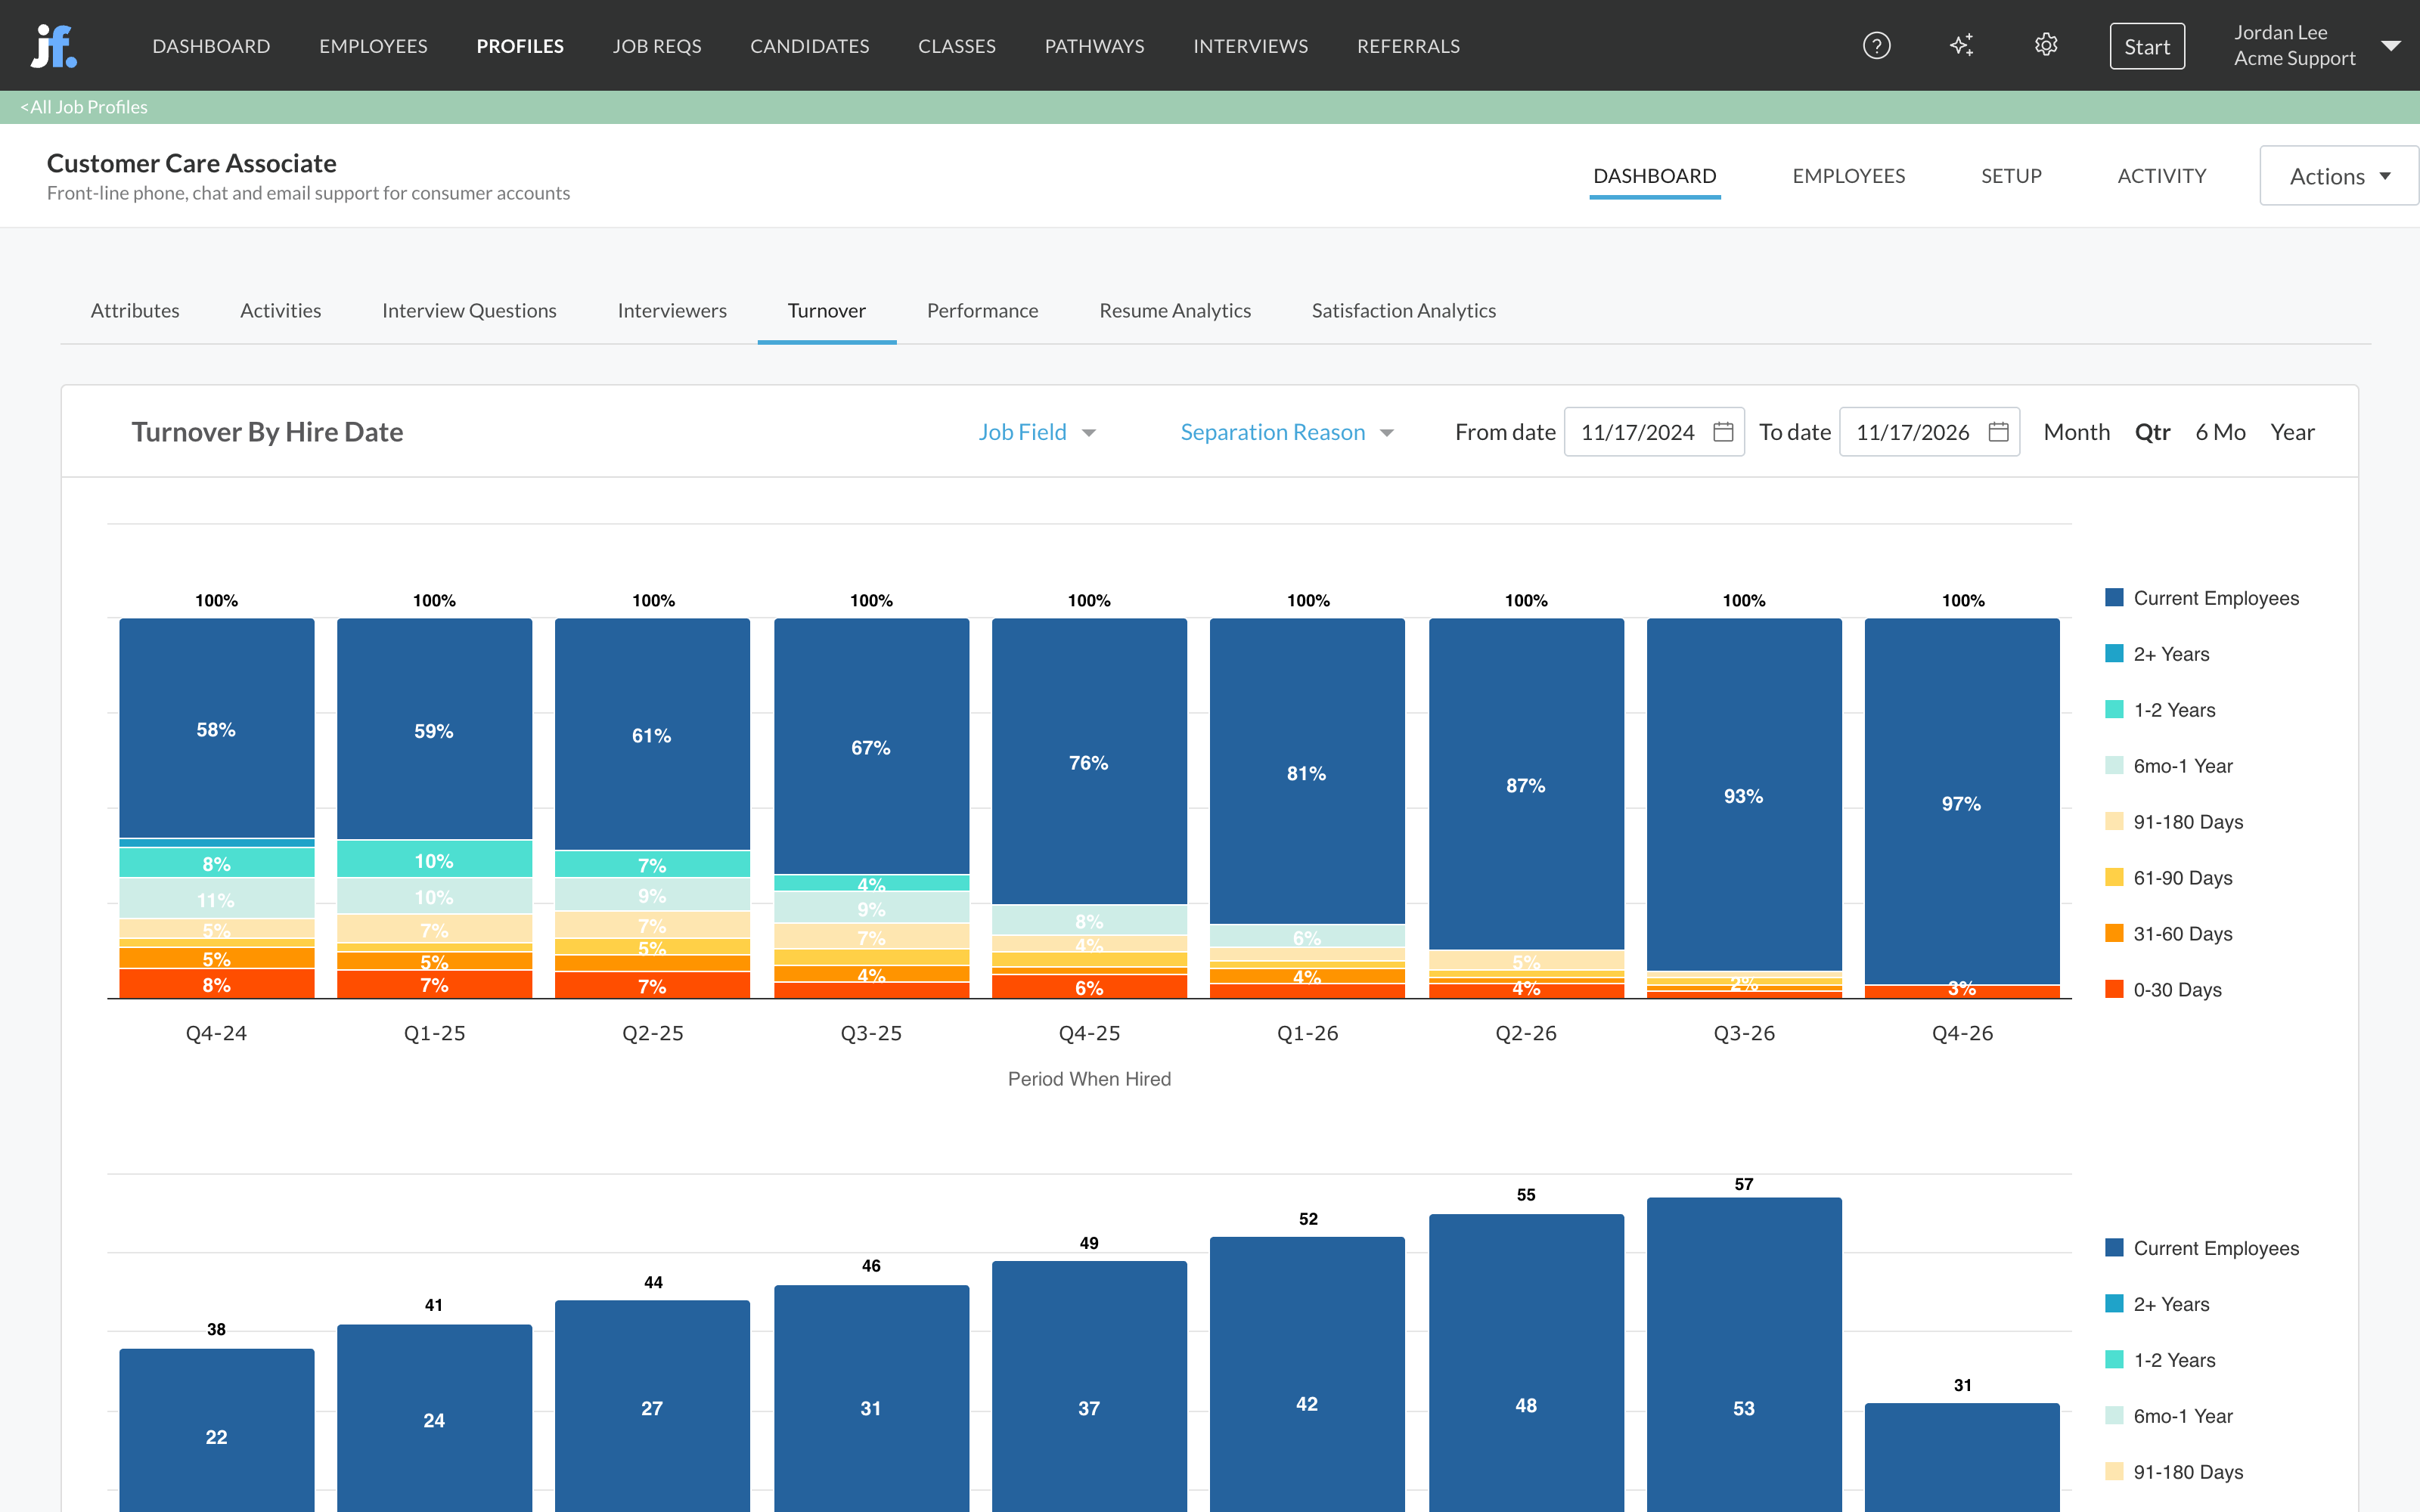
Click a bar to see the employees in it, with their job title, start and end dates, tenure and separation reason.
Performance
Performance By Hire Date groups your employees by when they were hired and shows the share at each performance rating, from Exceptional to Very Poor, so you can see whether newer groups of hires do better than earlier ones. Choose the Performance Type and Performance Period, and use the same dates, period and Job Field filter as on Turnover. A second chart shows the same as counts. Click a bar to see the employees in it.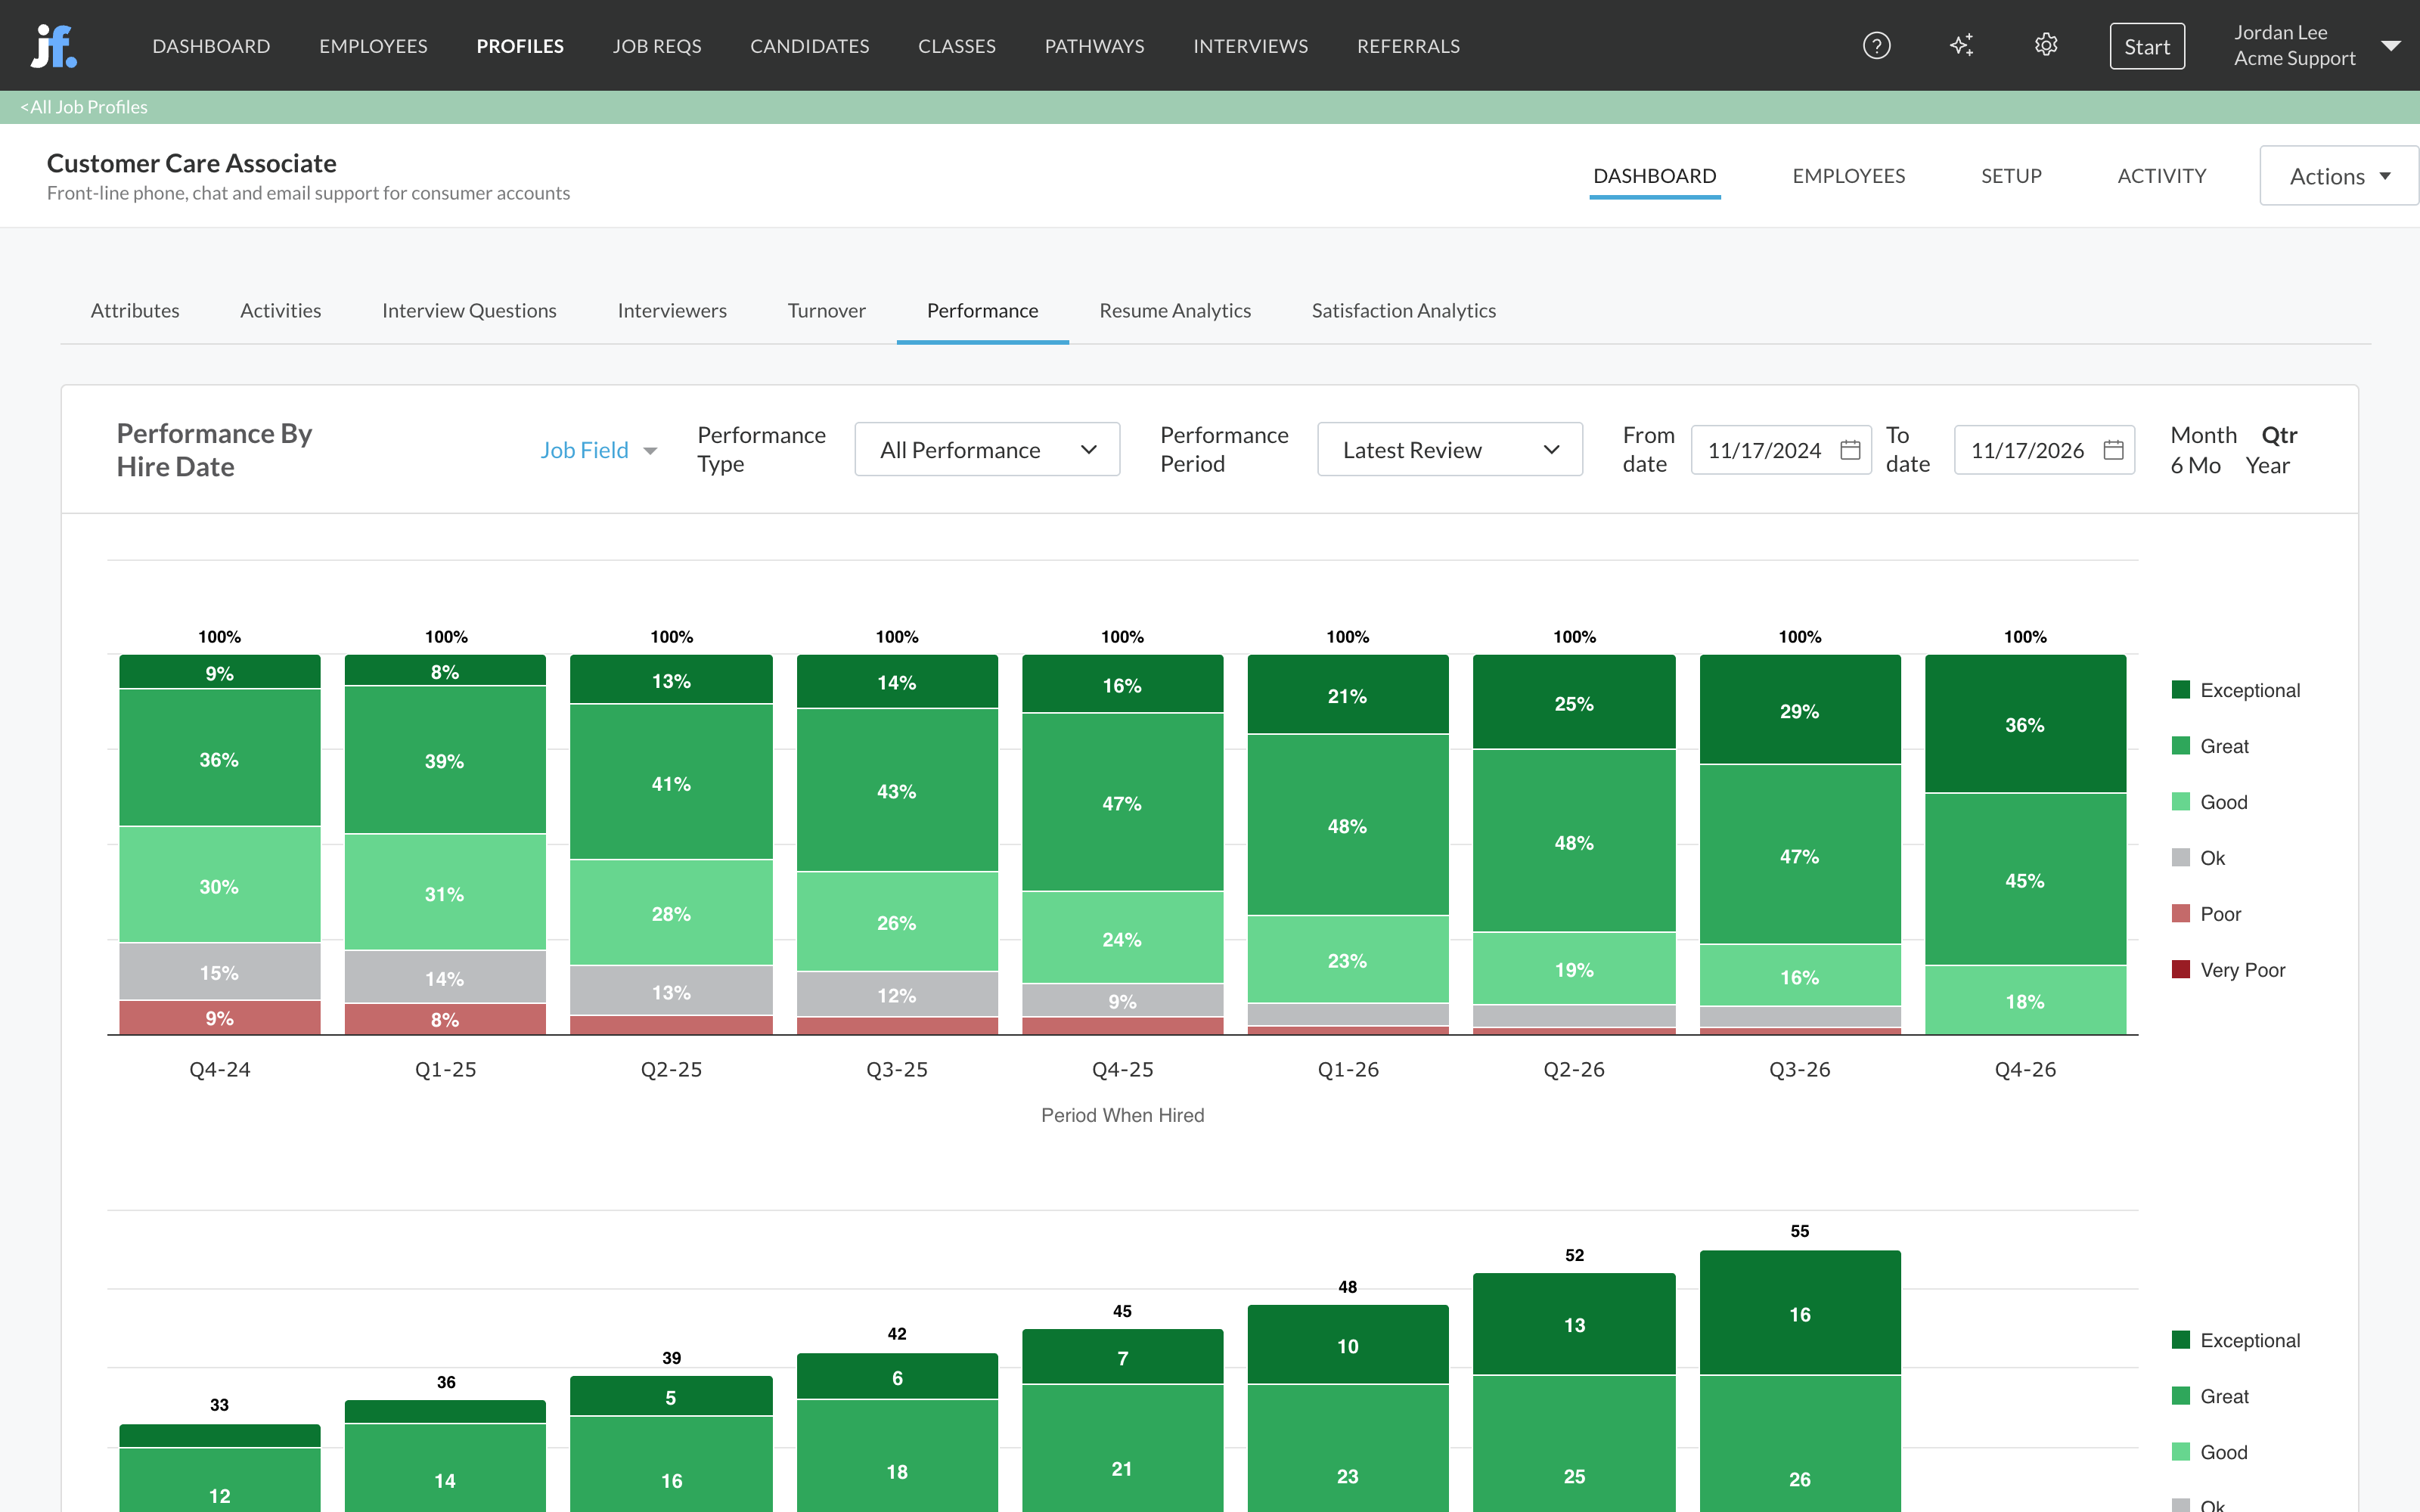
Attributes and activities
Attributes ranks the attributes you measure, such as Customer Focus or Problem Solving, by how closely candidates’ scores went with how they did after they were hired. Activities does the same for the activities in your workflow, such as an assessment or a typing test. Choose what to compare against in Top Attributes Correlated with: Overall Performance or Employee Retention. For performance, narrow it by Performance Type; for retention, by Separation Reason. Then set From Date and To Date.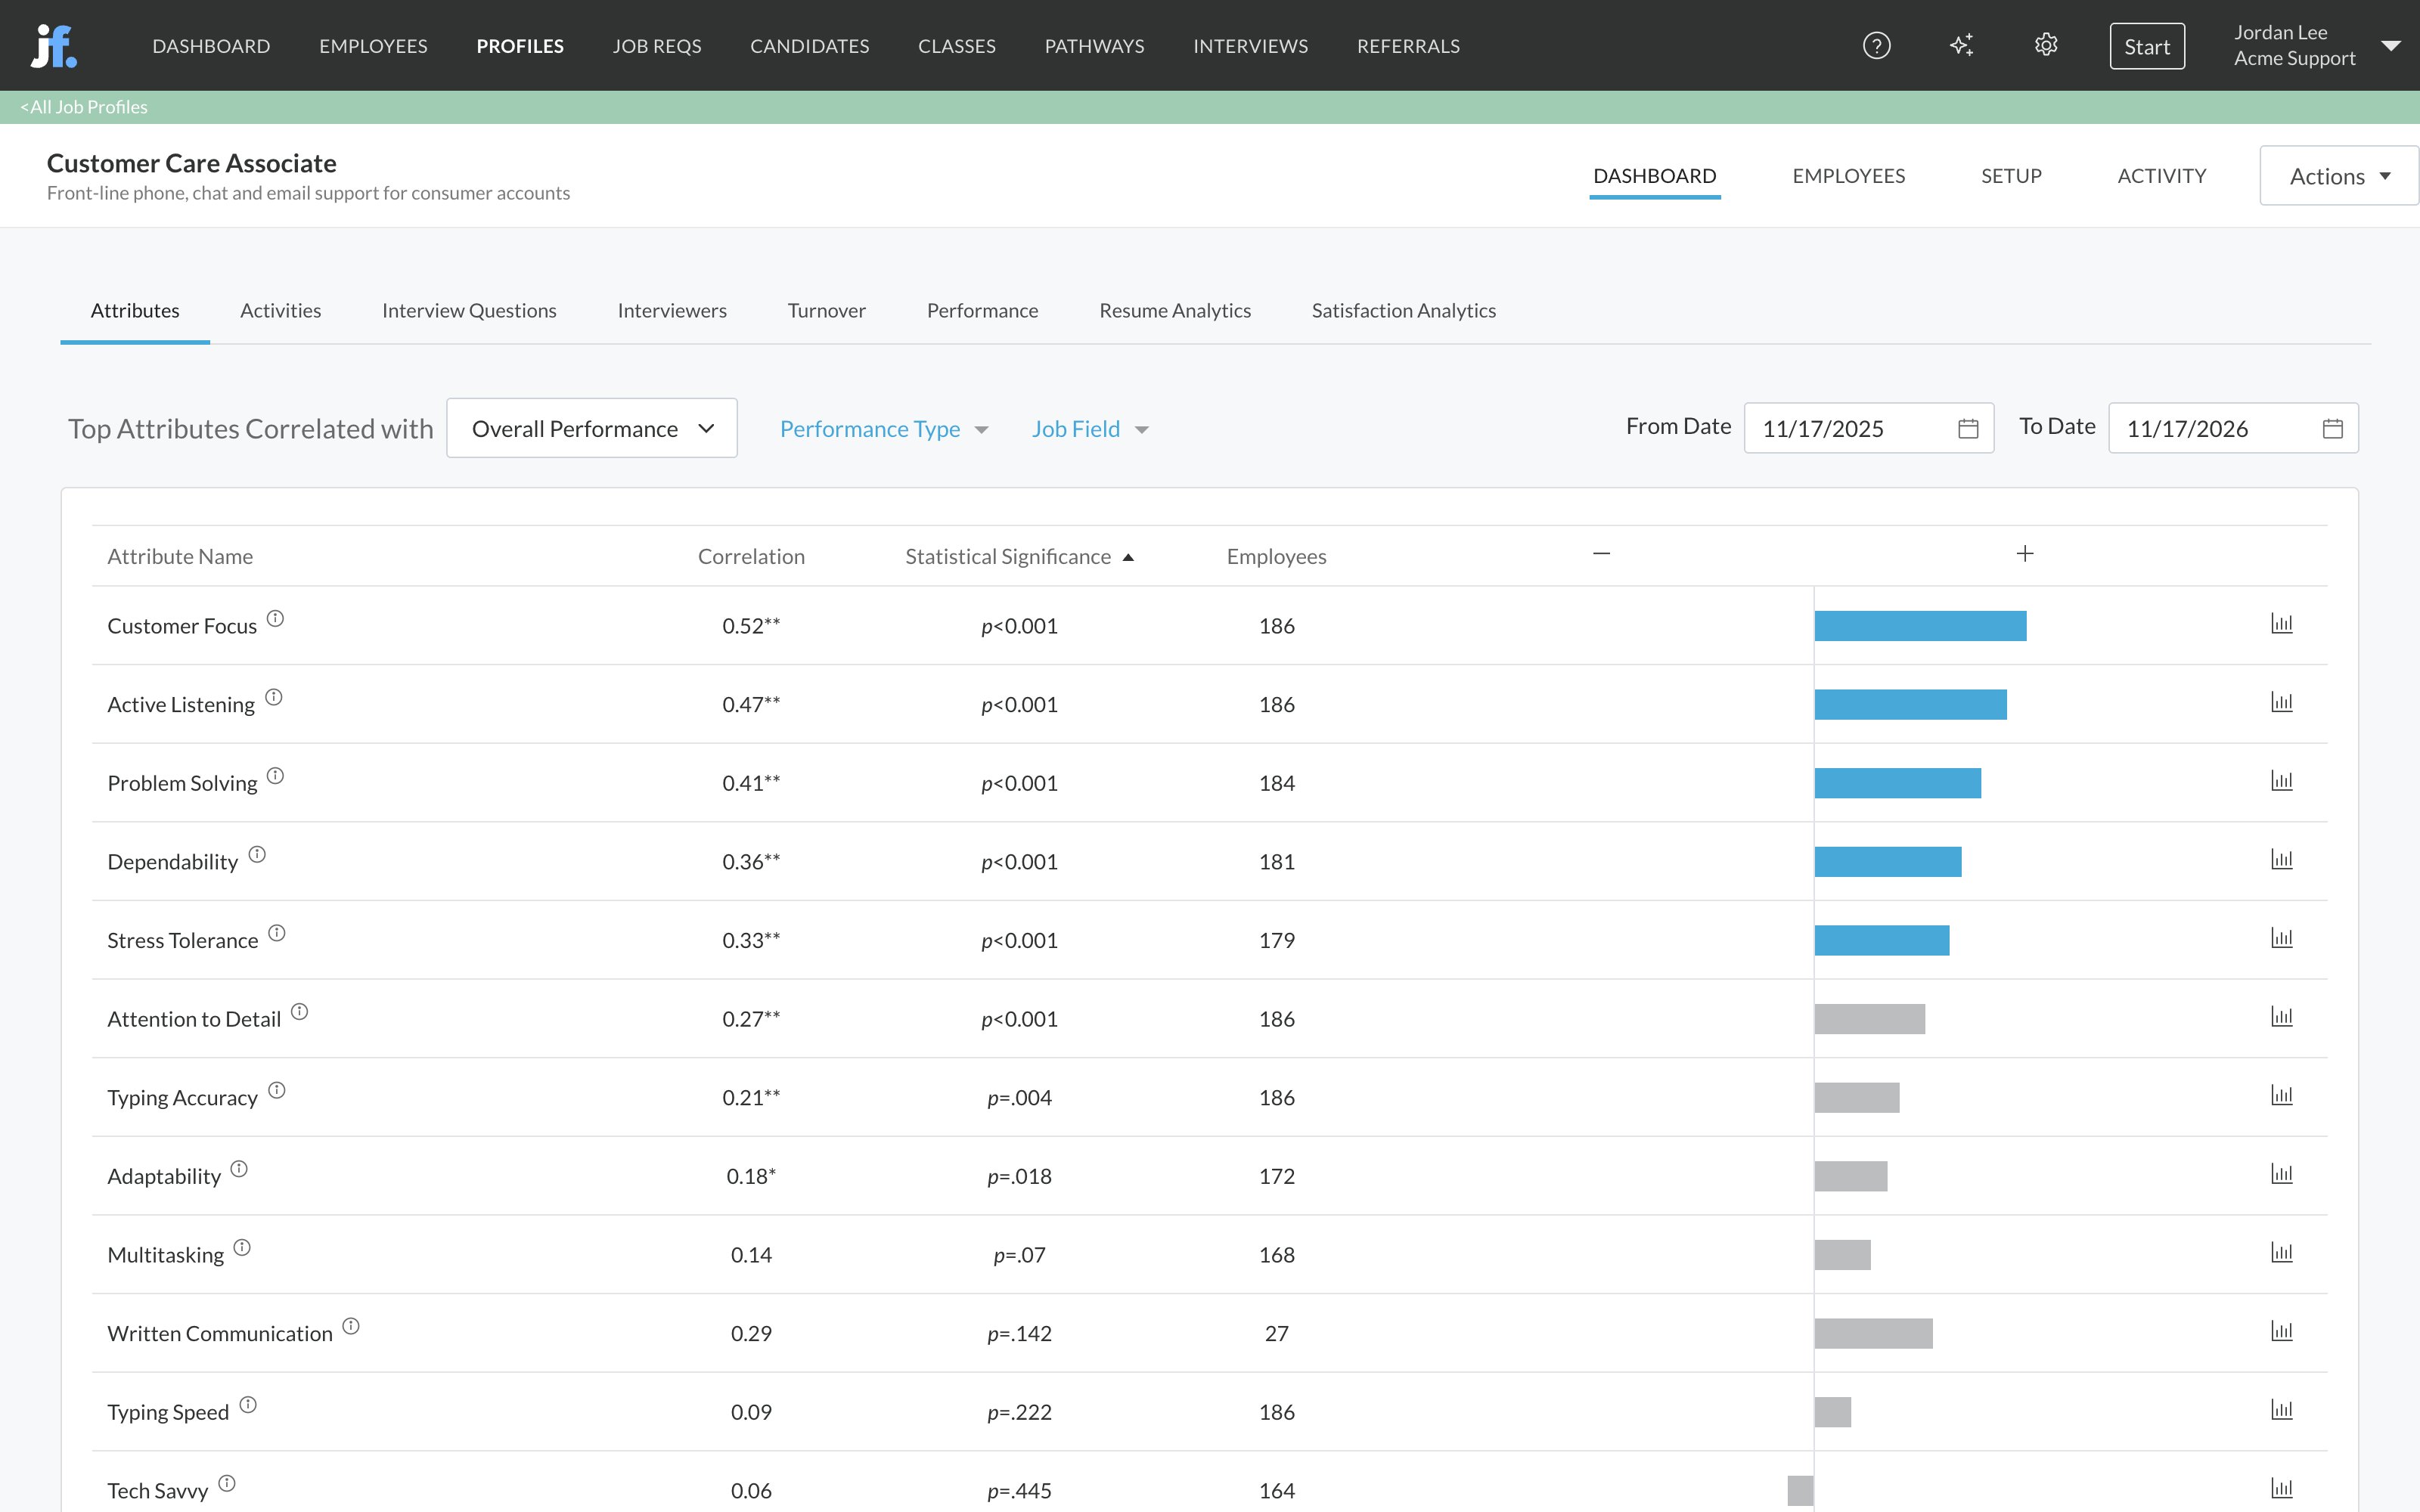
Hover over the info icon next to an attribute to see its description. See Attributes.
Interview Questions
Interview Questions uses the same table for individual interview questions, with an Attribute(s) Measured column. Use it to keep the questions whose scores predict performance or retention and to rework the ones that don’t predict anything. See Interview guides.Interviewers
Interviewers lists each interviewer with the number of Candidates and Interviews behind their result and their Accuracy: how closely their interview scores matched the hire’s later performance. 100% means their scores predicted performance exactly. Click the chart icon on a row to see each hire’s interview score next to their performance. See Interview analytics.The company versions
Attributes, Interview Questions, Interviewers, Turnover and Performance are also in the company Dashboard menu. They work the same way across every job profile in your account, which is useful for an account-wide turnover picture. For attributes, interview questions and interviewers, the job profile’s own Dashboard tab gives a clearer answer, because it compares people in the same role.Other views of quality of hire
Close the loop
Outcome data makes the rest of your hiring smarter:- Check what you measure. Use Attributes, Activities and Interview Questions to keep what predicts success and drop what doesn’t.
- Predict success. Journeyfront builds predictive models for your roles from your employees’ outcomes, such as performance and turnover. Candidates then get a predictive score that can count toward their overall score. See Predictive models.
- Coach interviewers. Use Interviewers accuracy to calibrate your panel.
FAQ
Why is the Turnover dashboard empty?
Why is the Turnover dashboard empty?
It needs employee records with start dates, and end dates for anyone who left. Check that hires are being recorded (hiring a candidate creates the record) and that separations are entered on the employee’s Job Info tab, synced from your HR system or imported. Also check your date range and filters.
Why does Attributes say Insufficient Data?
Why does Attributes say Insufficient Data?
A correlation needs at least 10 employees with both a score and an outcome. Widen the date range, or wait until more of your hires have performance reviews or separations recorded.
Why can't I click into a chart?
Why can't I click into a chart?
Seeing the employees behind the charts needs Performance Access. Ask your Journeyfront admin to check your security role.
Where do performance scores come from?
Where do performance scores come from?
From performance reviews your team submits under Start, then Performance Review, and from performance data imported under Settings, then Import Data. See Performance reviews.
Does Journeyfront update end dates from our HR system?
Does Journeyfront update end dates from our HR system?
Yes, when your HR system is connected and its employee sync is on. Employees terminated in your HR system get an end date and a separation reason on the next sync. See HRIS integrations.
Related
Predictive models
Turn your outcome data into a predictive score for candidates.
Job profiles
Where each role’s Dashboard tab lives.
Performance reviews
Record how employees perform.
Employee records
Where start dates, end dates and separations live.