

Who can do this: The company Time To Hire and Funnel Analytics dashboards need Company Dashboard Access. A job req’s Funnel Analytics tab needs access to that job req.
- Median: the middle value. Half your hires took less time and half took more. This is the best headline number, because a few very slow hires don’t pull it up.
- Average: the total days divided by the number of hires. A handful of slow hires can raise it a lot, so a big gap between the average and the median means you have outliers.
Company-wide
Click Dashboard in the top navigation and choose Time To Hire. It shows every job req in your account; use the Job Profile and Job Req controls to focus. Other controls include From and To (application date), Candidate Country, Candidate Region/State, Candidate City, Assigned User, Source Type and Source.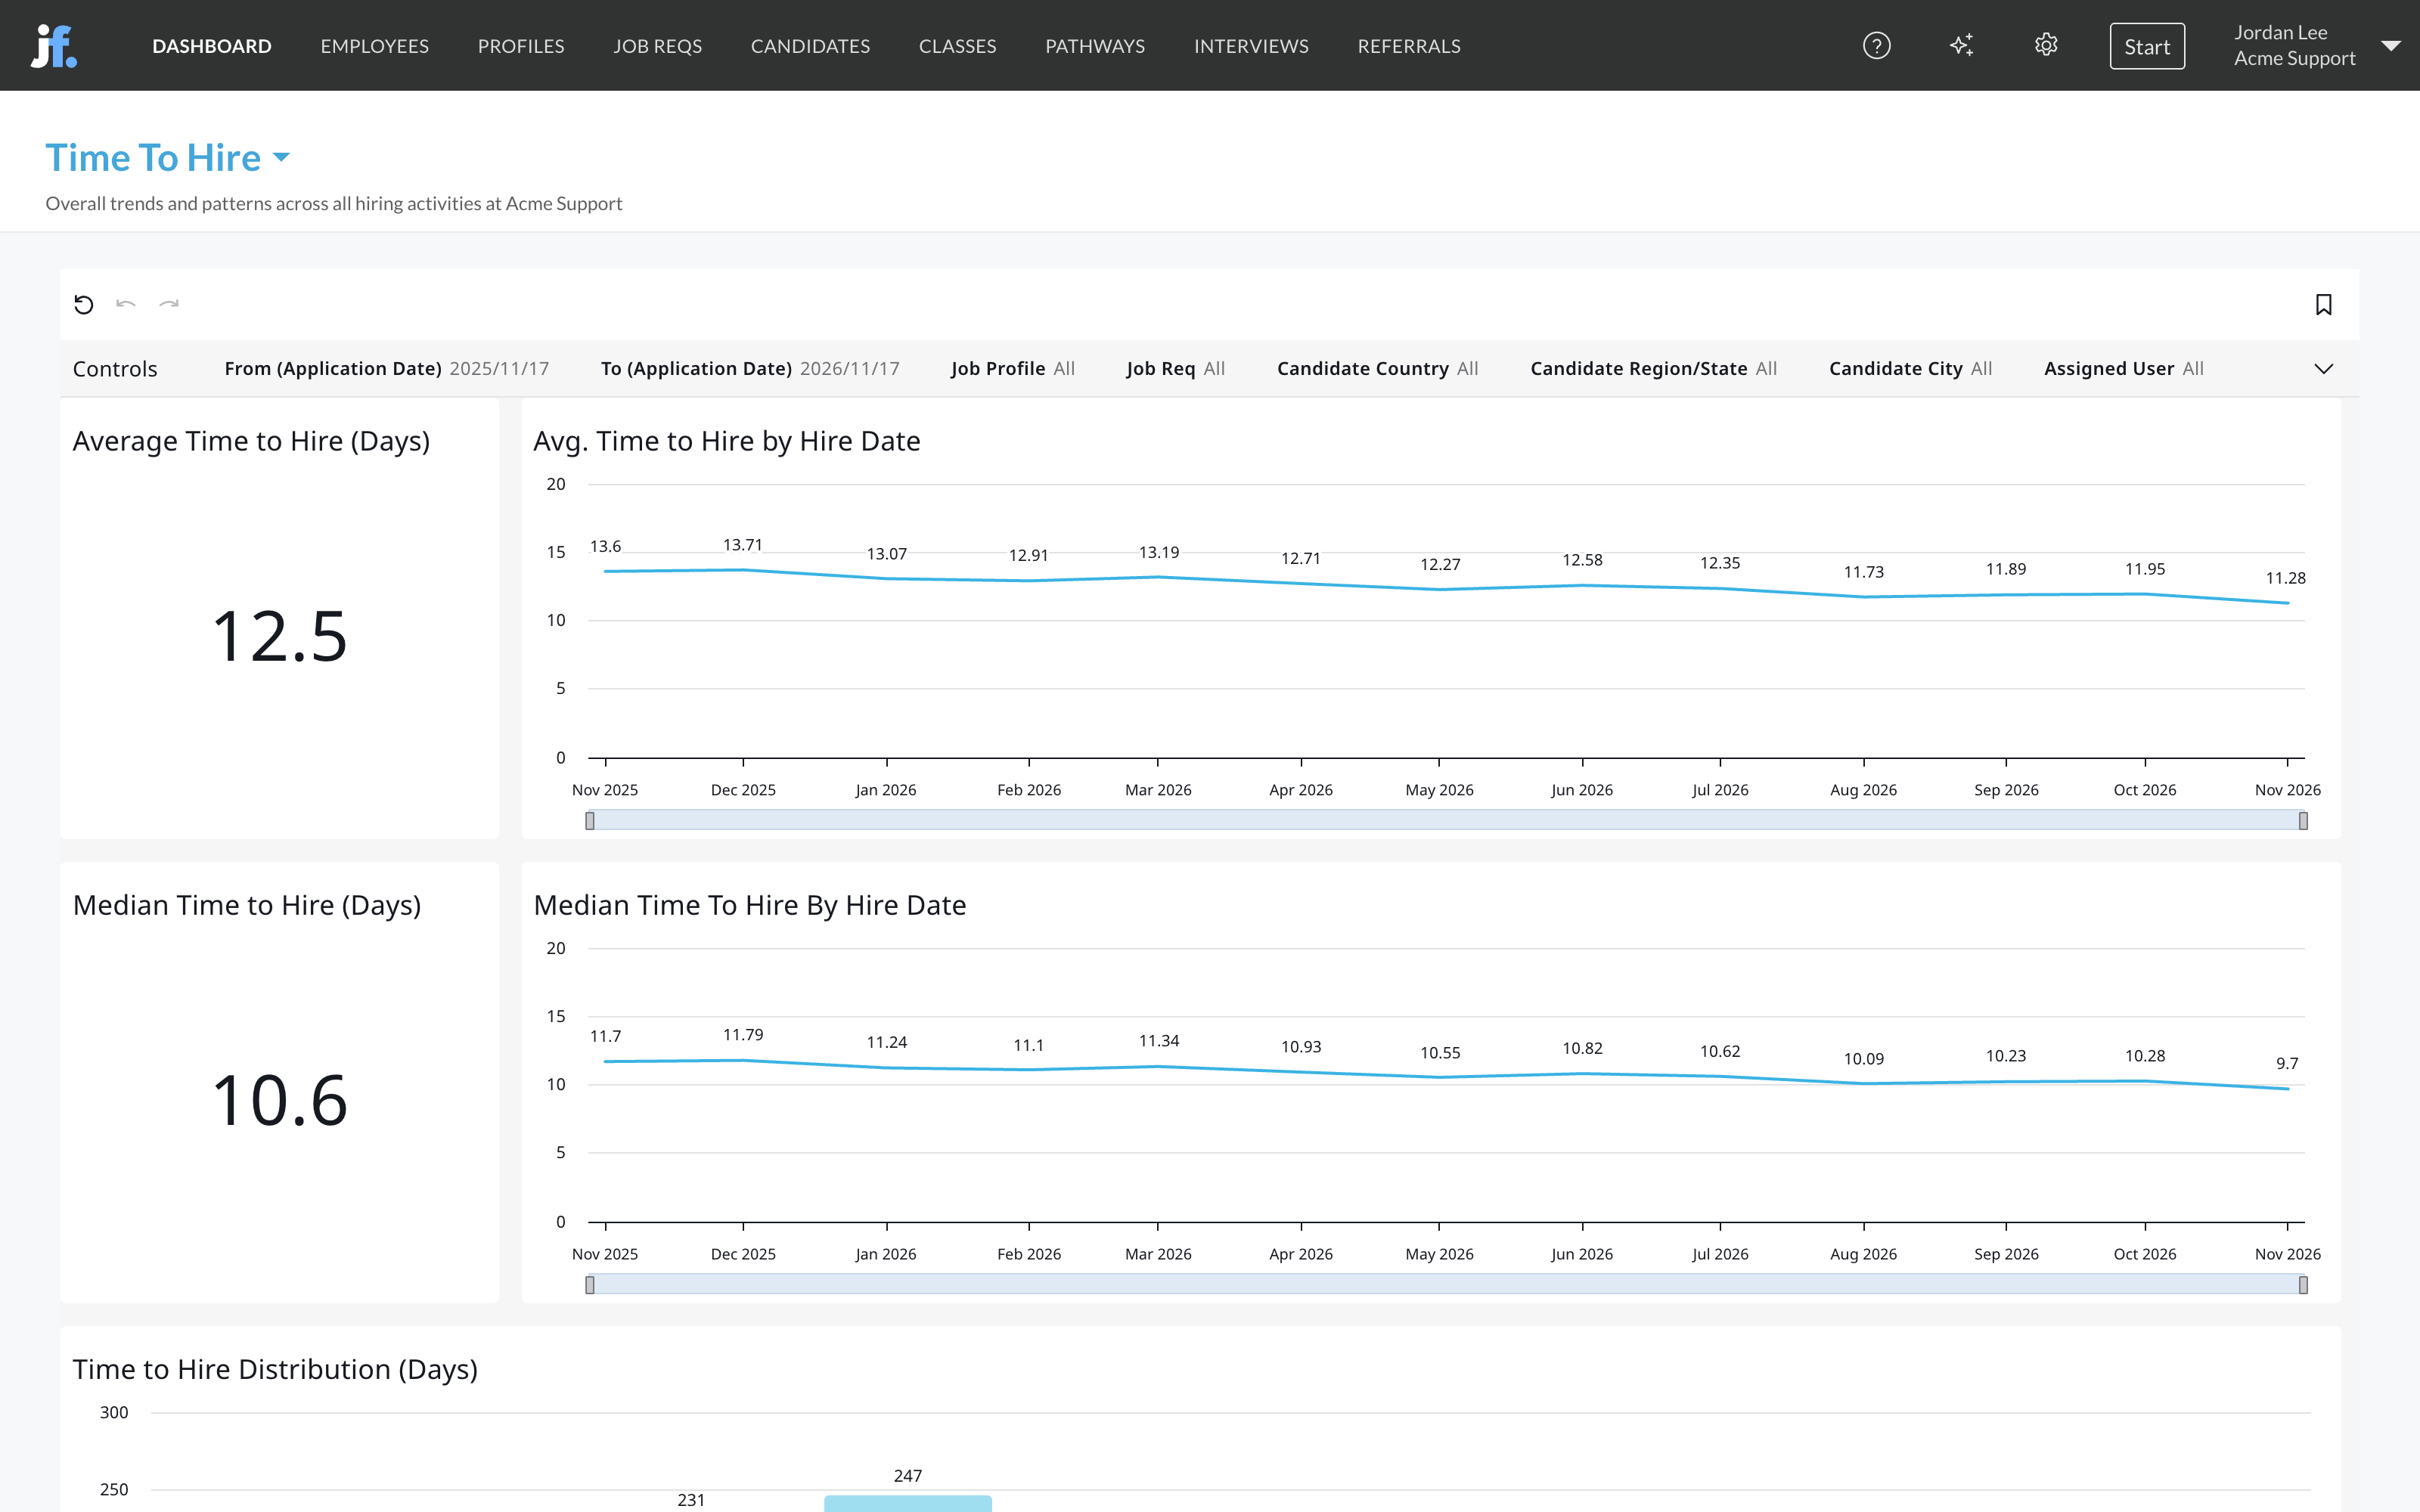
The Funnel Analytics Time to Hire sheet
The Funnel Analytics dashboard has its own Time to Hire sheet. It adds two things the Time To Hire dashboard doesn’t have:- Median Time to Hire by Assigned User: how fast each recruiter’s candidates get hired.
- Recent Hire Information: a table of each hire, with their application start, hiring class, hire date, start date, assigned user and days to hire. Use it to check the people behind a number.
For one job req
Open the job req, click its Dashboard tab, then Funnel Analytics, then the Time to Hire sheet. The Overview sheet also shows Average Time to Hire (Days) at the top.Find the step that slows you down
Time to hire tells you how long; time in step tells you where. On Funnel Analytics:- Median Time in Each Step (Days) on the Overview sheet shows how long candidates spend in each step.
- Time in Step Distribution on the Step Analysis sheet shows how many candidates sat in each step for less than 15 minutes, a day, a week and so on, so you can see the long tail.
- Median Days in Step by Job Req on the Compare Job Reqs sheet compares the same steps across job reqs.
How teams use it
- Report the median. Use Median Time to Hire for your monthly number and watch the trend line by hire date. Look at the average only to spot outliers.
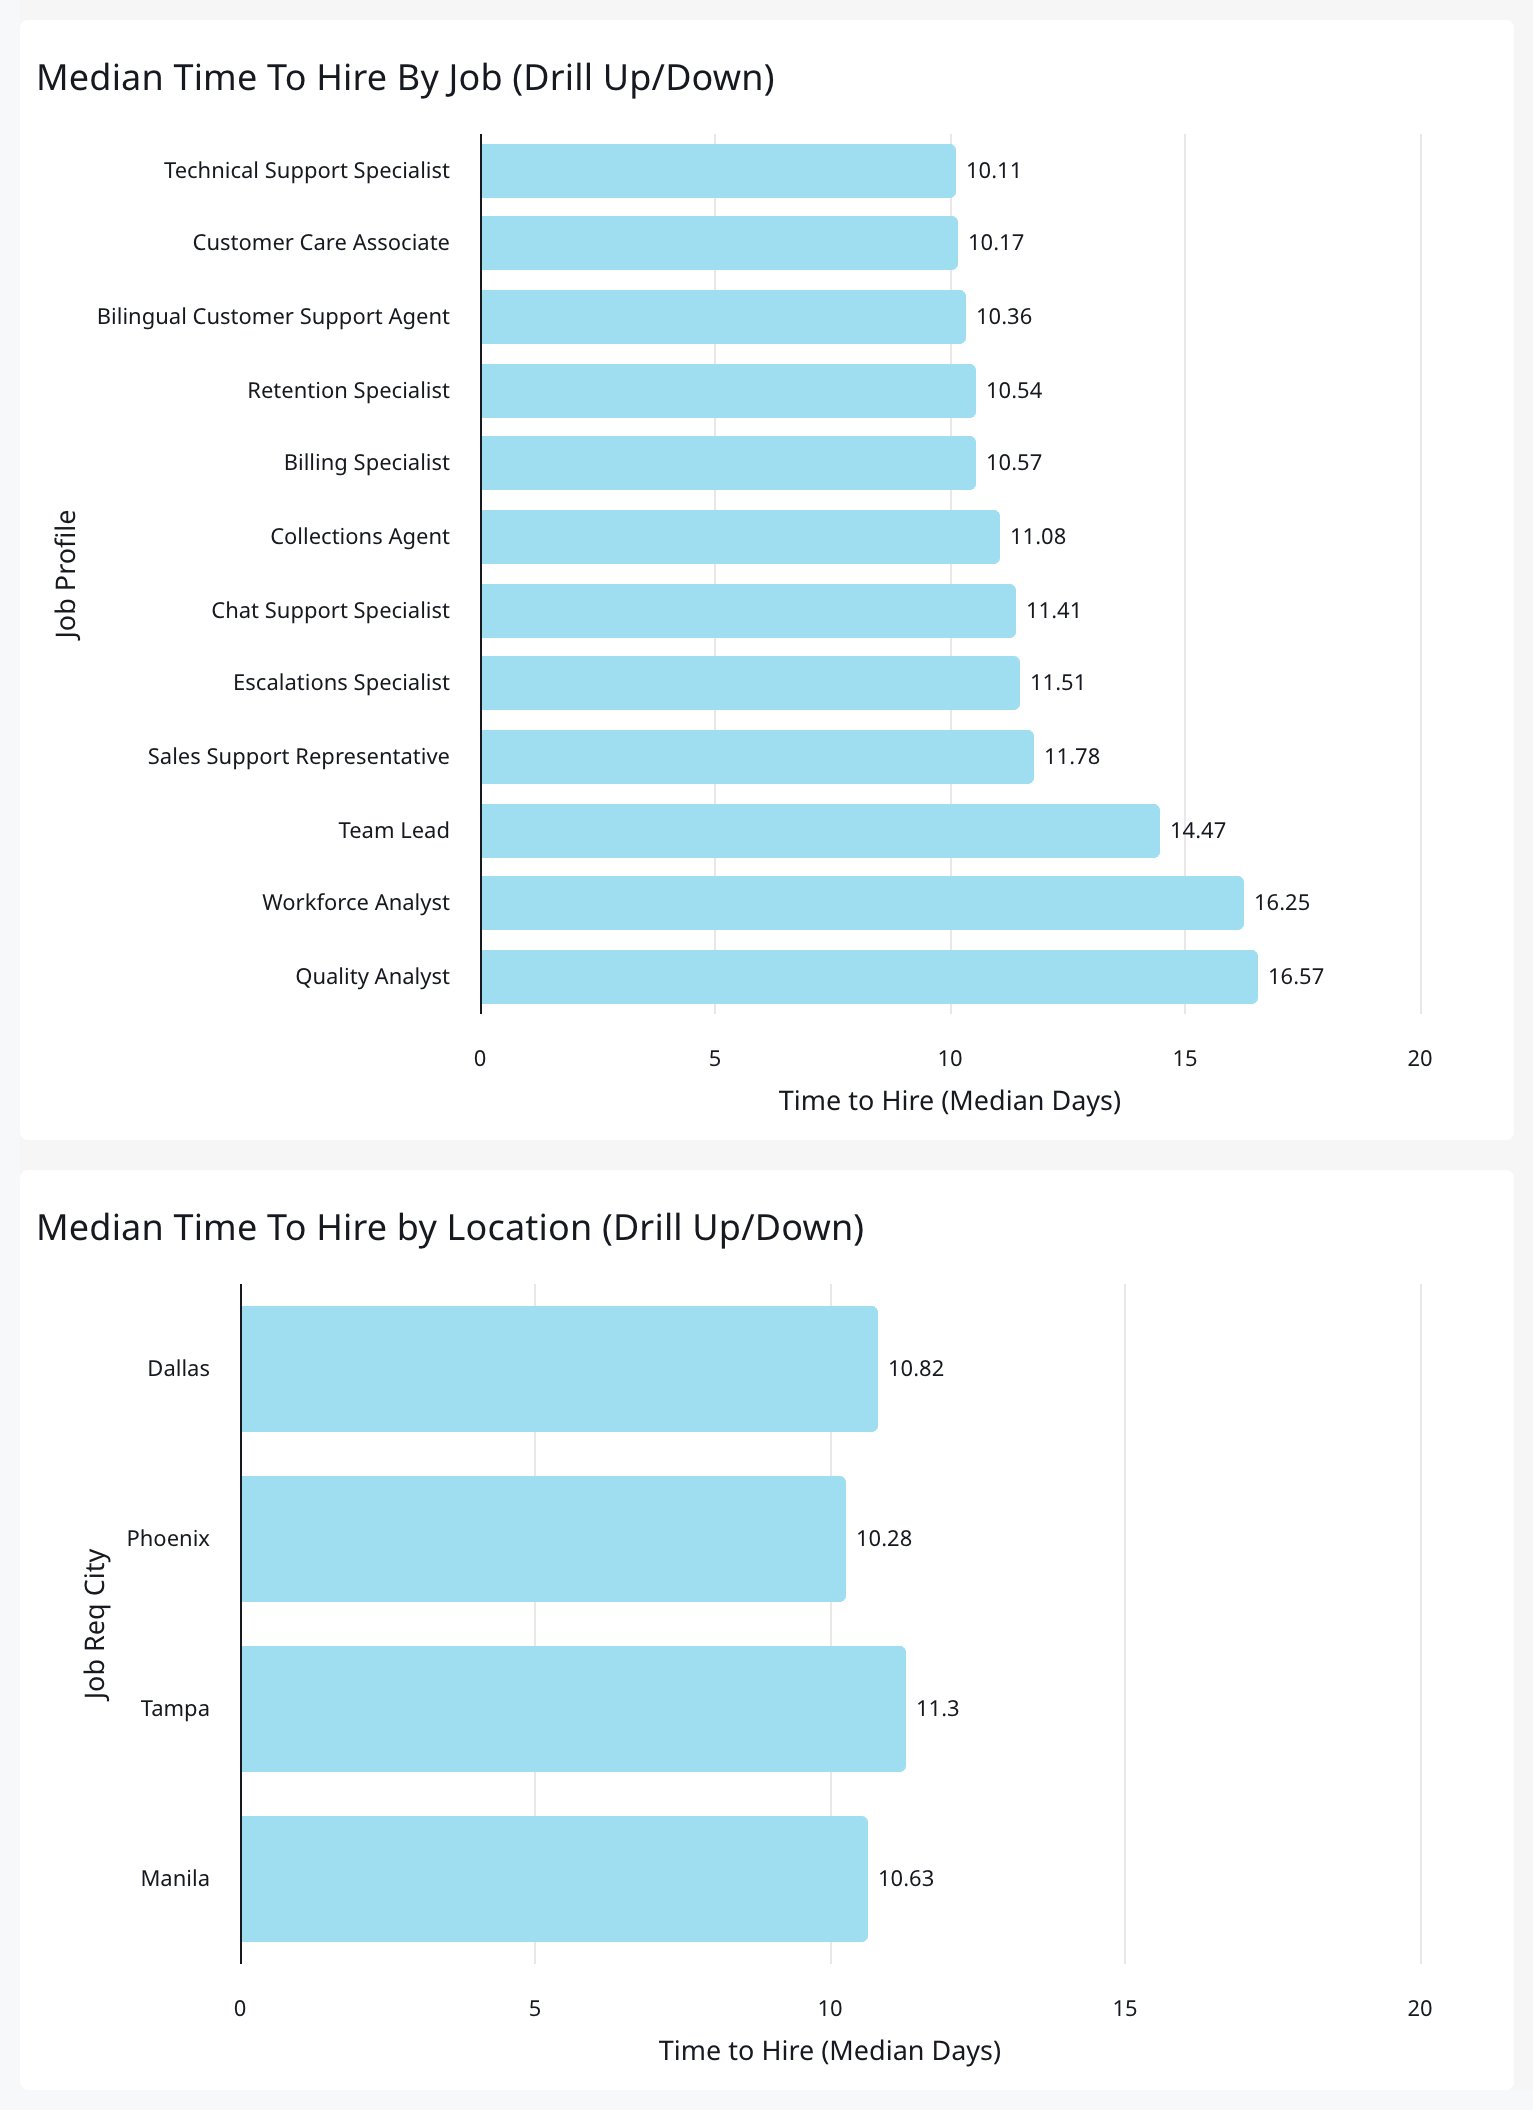
- Find slow sites. Find the slowest city on the location chart, then compare that site’s steps with a fast one’s on Compare Job Reqs. The difference is often one step, such as a manager interview that waits for availability.
- Shorten waits, not assessments. If candidates finish a step quickly but wait days to be moved on, the delay is on your side. Automation rules or faster scheduling can close that gap.
- Coach by recruiter. Median Time to Hire by Assigned User and the Recruiter productivity dashboard show whose candidates move fastest.
FAQ
Does time to hire end when the offer is accepted or when the candidate starts?
Does time to hire end when the offer is accepted or when the candidate starts?
Neither. It ends when the candidate is marked as hired in Journeyfront. Start dates are reported separately, for example in Recent Hire Information.
Why is the average so much higher than the median?
Why is the average so much higher than the median?
A few hires that took a very long time pull the average up. The median isn’t affected by them, so use it as your headline number.
Related
Funnel and drop-off
Where candidates leave, and how long each step takes.
Recruiter productivity
Time to hire and more by recruiter.
Applicant volume and pipeline
Applicants, hires and hiring classes.
Dashboards overview
Where dashboards live and how to filter them.