

Who can do this: Company dashboards need the Company Dashboard Access permission. A job req’s Dashboard tab needs access to that job req. A job profile’s Dashboard tab needs access to that job profile. Seeing the employees behind some charts also needs Performance Access.
Where reporting lives
There are three places to find dashboards, from widest to narrowest.
Company dashboards show data for every job req in your account. To focus on one role, location or req, use the Job Profile and Job Req controls at the top of the dashboard.
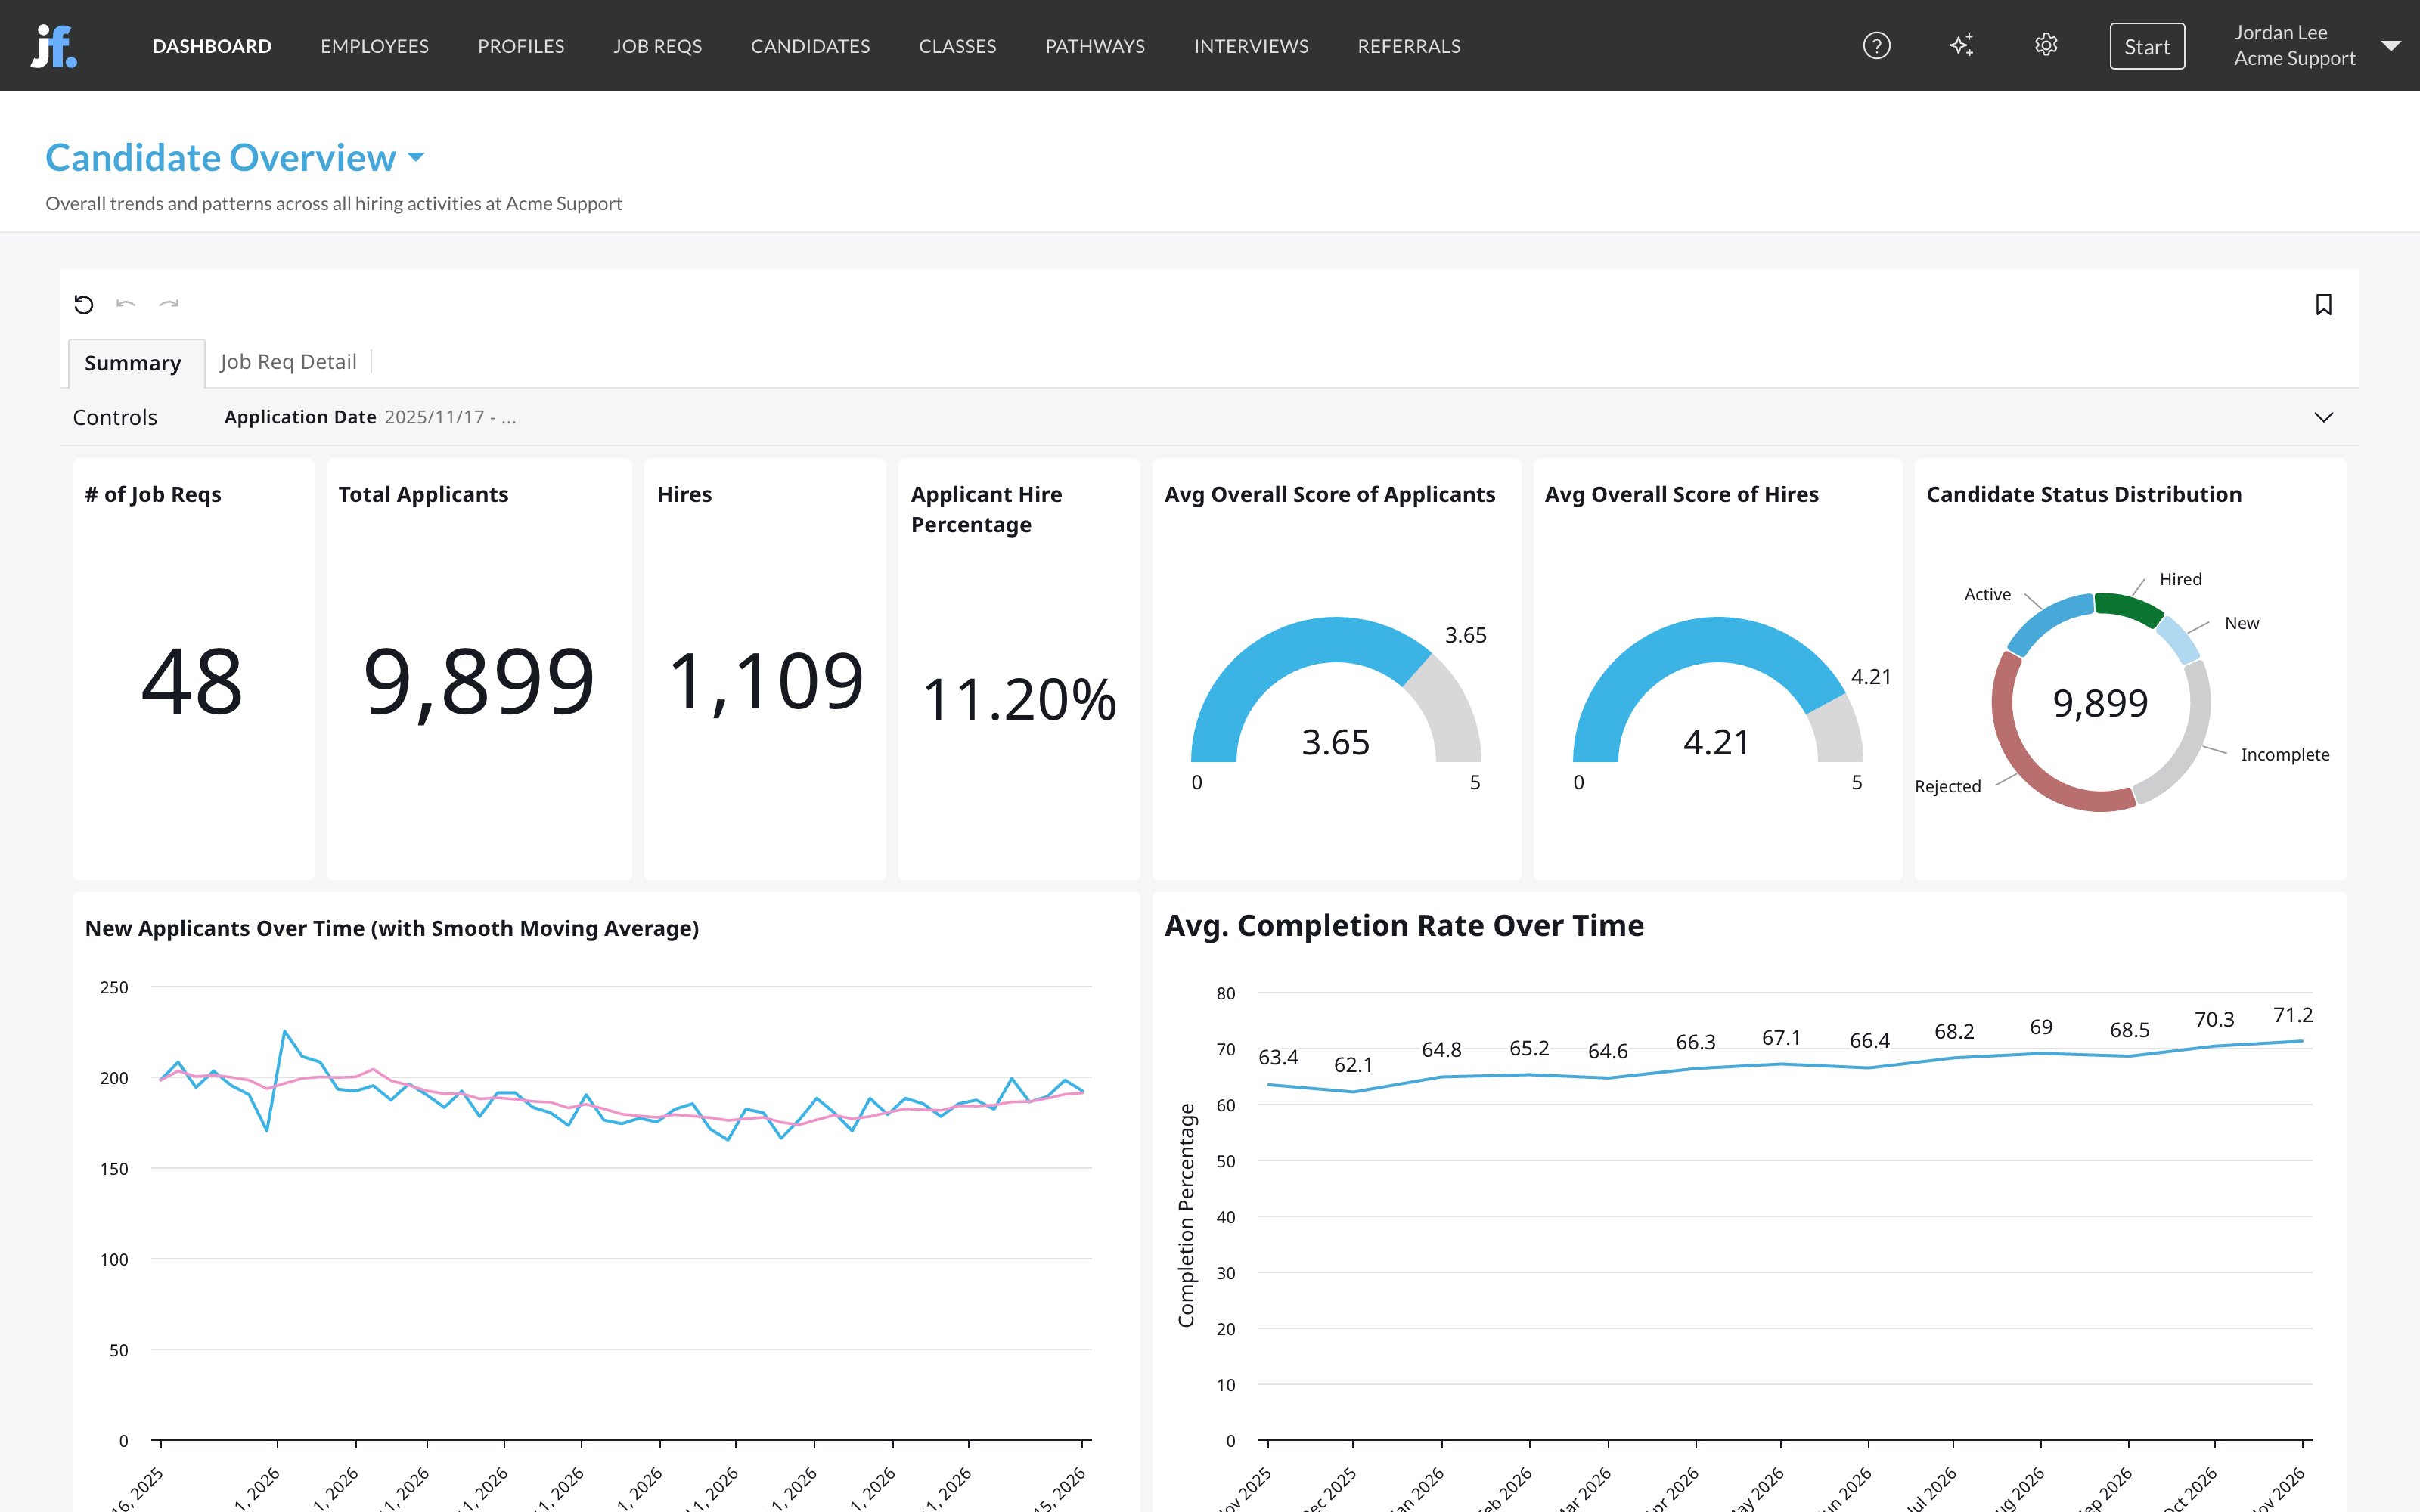
Open a company dashboard
1
Click Dashboard
Click Dashboard in the top navigation. It opens on Candidate Overview. If you don’t see Dashboard, your security role doesn’t have Company Dashboard Access.
2
Choose a dashboard
Click the dashboard’s name at the top of the page to open the menu, then pick a dashboard or type in Search to find one.
A job req’s Dashboard tab
Every job req has a Dashboard tab with six tabs of its own: Overview, Interviews, Hiring Process Fidelity, Funnel Analytics, Language Assessment and Source Effectiveness. They’re already filtered to the job req, so there’s no job req control to set. See Job req dashboards.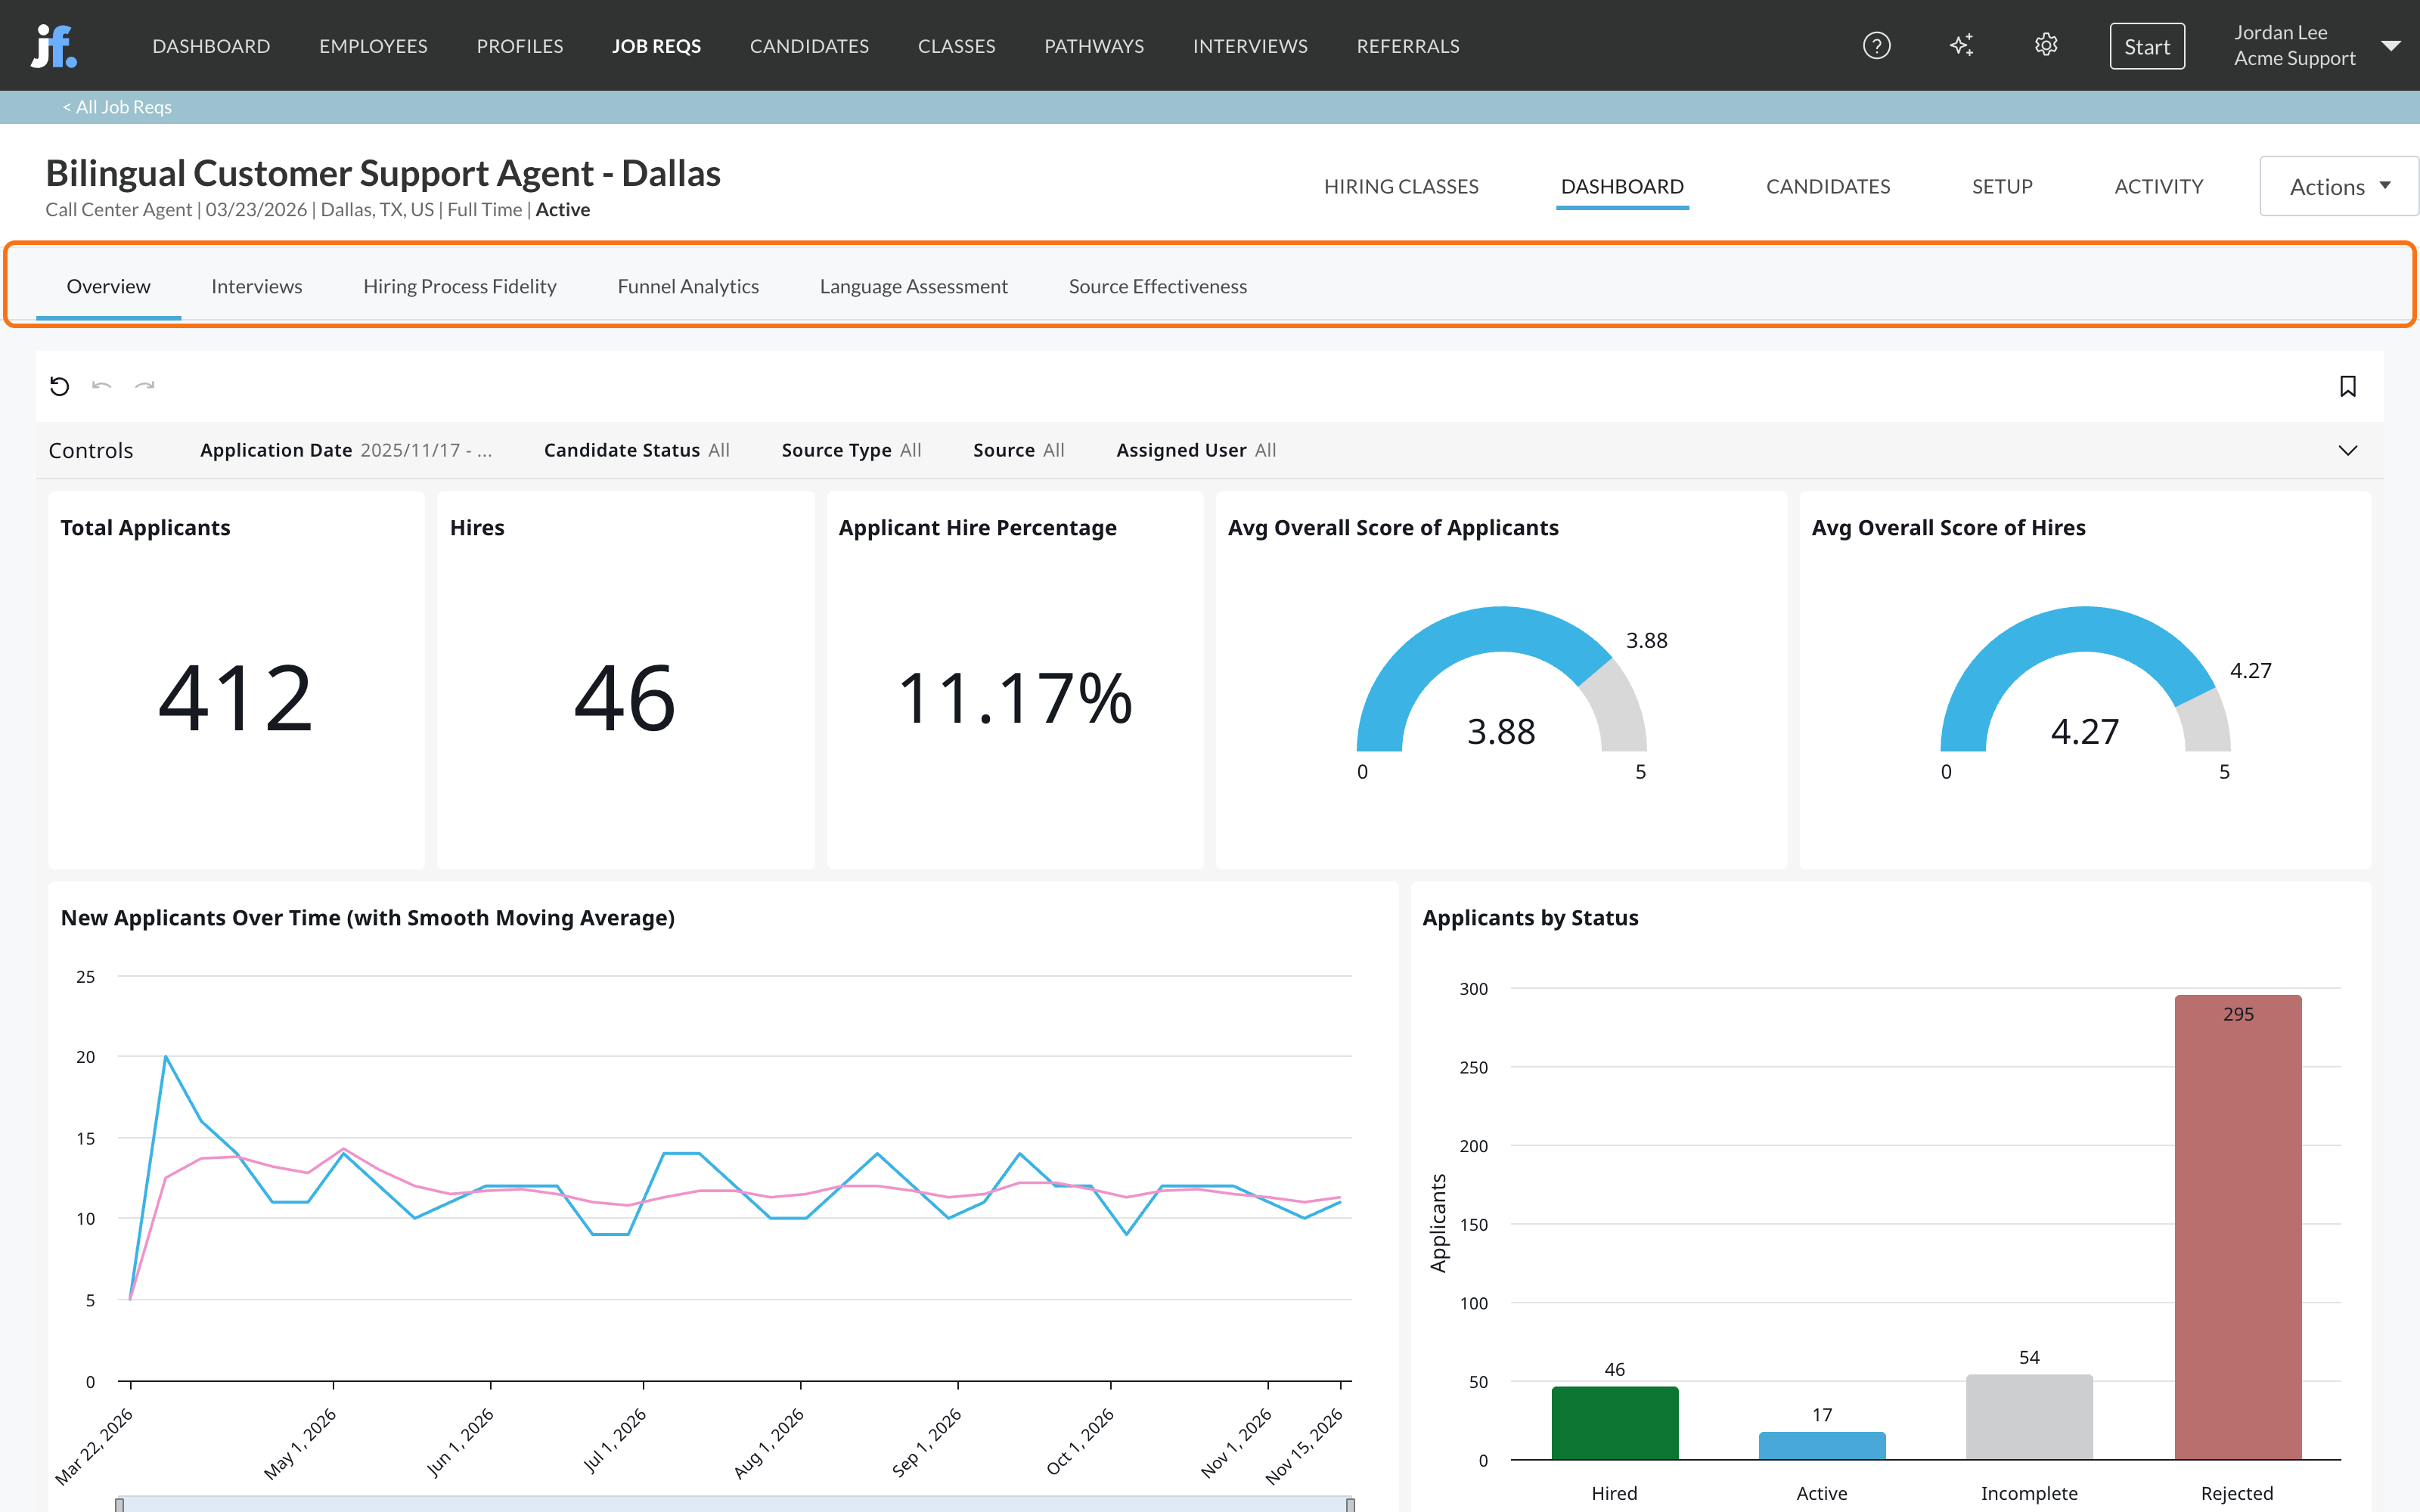
A job profile’s Dashboard tab
A job profile’s Dashboard tab compares what you measured during hiring with how the people you hired into that role went on to do. It’s the main place for Turnover, Performance, Attributes, Activities, Interview Questions and Interviewers, because those results are most useful for one role at a time. See Quality of hire.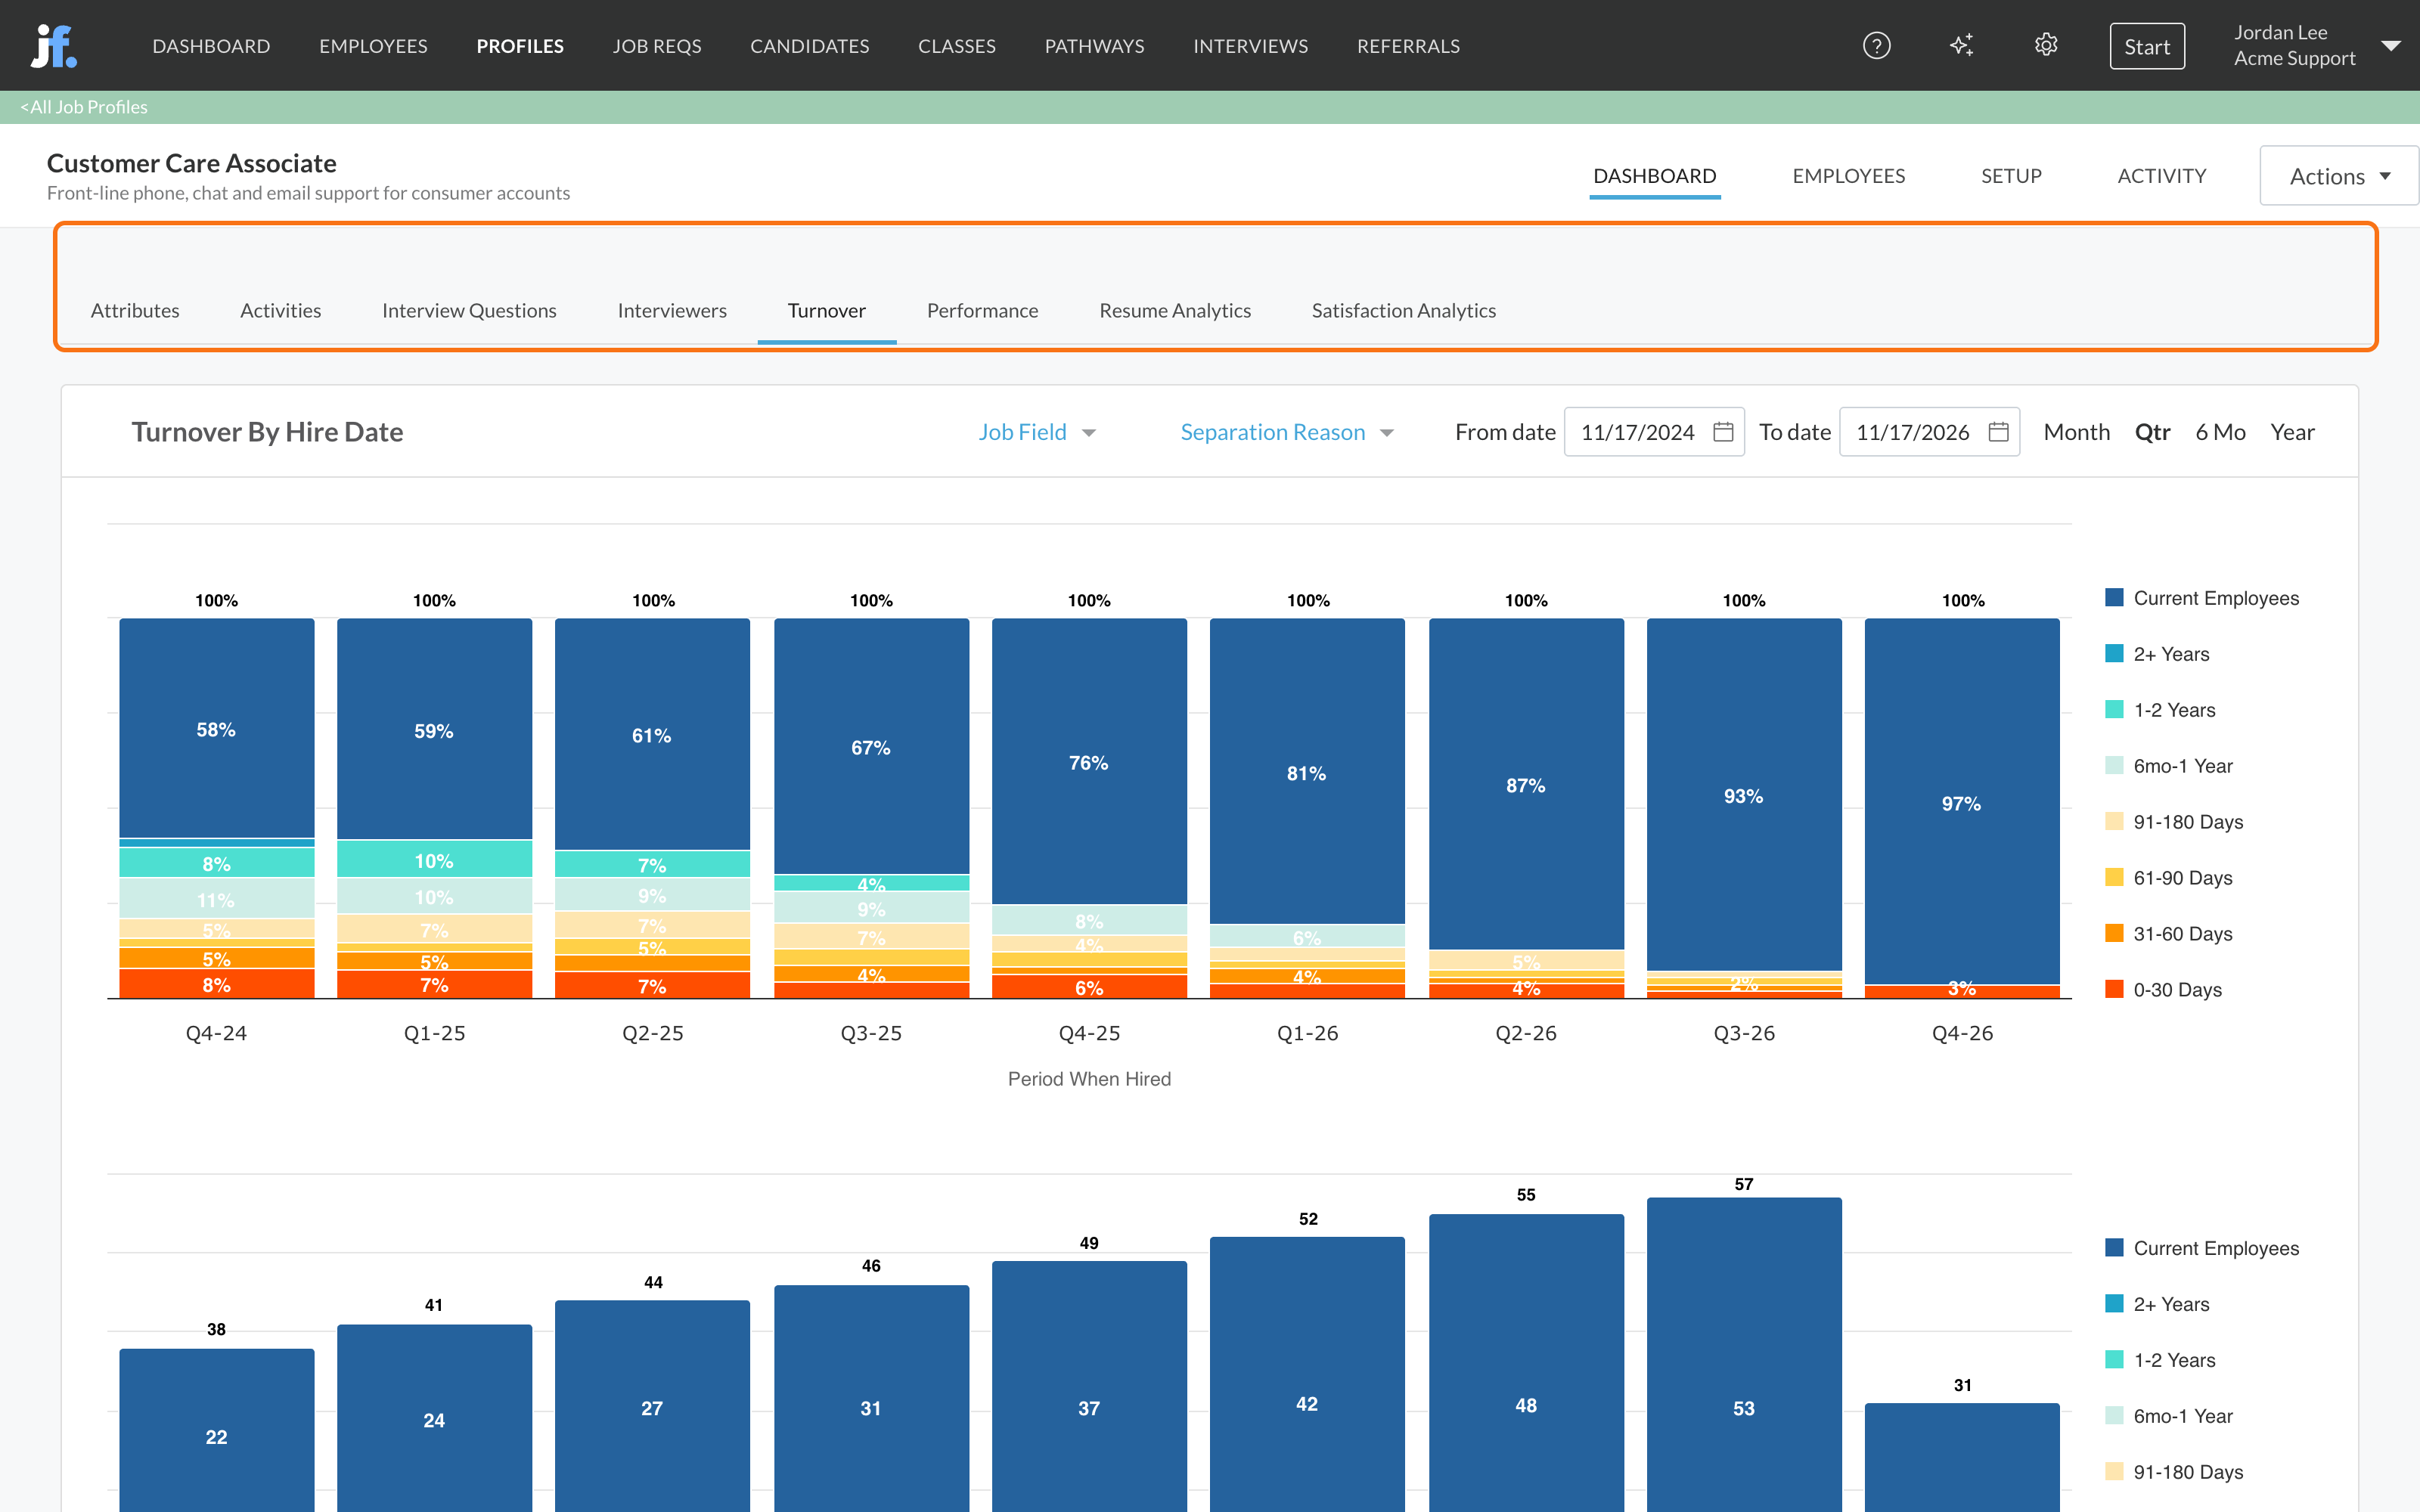
Which page answers your question?
Filter a dashboard
Most dashboards have Controls at the top. Click a control to narrow the data, for example by Application Date, Job Profile, Job Req, Source Type, Source or Hiring Class. Each dashboard has its own set of controls, and the arrow at the right end of the bar shows the rest. Some dashboards have several sheets, shown as tabs above the controls. The Turnover, Performance, Attributes, Interview Questions and Interviewers dashboards have their own filters above their charts instead, such as From Date and To Date.Drill into a chart
Hover over a chart to see the exact numbers. Charts with (Drill Up/Down) in their title let you change the level, for example from job profile down to job req, or from country down to city. On some tables, clicking a row filters the rest of the dashboard: on Funnel Analytics, clicking a row on the Job Reqs sheet selects that job req. On Turnover and Performance, click a bar to see the employees behind it.Save your filters as bookmarks
Bookmarks save a set of filters on a dashboard, so you don’t have to set them again every visit. For example, save “Customer Care Associate, last quarter” on Funnel Analytics.
1
Set your filters
Open the dashboard and set the Controls the way you want them.
2
Add the bookmark
Click the bookmark icon in the dashboard’s toolbar, then Add bookmark. Give it a name that describes the filters and click Save.
3
Use it later
Click the bookmark icon and choose your bookmark. Its filters are applied right away.
Tables and exporting
Many dashboards end with a table of the candidates, hires or interviews behind the charts, such as Candidate Details on Candidate Overview. Use them to check a number or find a specific person. Dashboards don’t have a print or PDF option. For a spreadsheet of candidates or job reqs, export from the Candidates or Job Reqs page. See Export data.Language assessment results
If your job reqs use a language assessment, the Language Assessment dashboard shows how many tests were taken, how CEFR levels are spread, how candidates at each level moved through hiring, and how levels compare by job req, location and source. A Language Results sheet lists every result. It’s in the company Dashboard menu and on each job req’s Dashboard tab. See Language assessments.FAQ
Why is a dashboard empty?
Why is a dashboard empty?
Check the Controls first: a narrow date range or filter can leave nothing to show. The Turnover, Performance, Attributes, Interview Questions and Interviewers dashboards also need employee data, such as end dates and performance reviews. See Quality of hire.
Why don't the numbers match the Candidates page?
Why don't the numbers match the Candidates page?
Dashboards count by the dates and filters in their Controls, and each dashboard counts a little differently, for example by application date or by start date. Match the date range and filters before comparing.
Can I see a dashboard for just my job reqs?
Can I see a dashboard for just my job reqs?
Company dashboards include every job req in your account. Use the Job Req control to pick yours, and save the selection as a bookmark. Or use each job req’s own Dashboard tab.
Related
Job req dashboards
The six dashboard tabs on every job req.
Funnel and drop-off
Find the step where candidates leave.
Quality of hire
How your hires stay and perform, by job profile.
Export data
Download candidates and job reqs to a spreadsheet.