

Who can do this: The company Source Effectiveness dashboard needs Company Dashboard Access. A job req’s Source Effectiveness tab needs access to that job req.
Source or source type
The Analysis Level control switches every chart on the dashboard between single Source values and Source Type groups. Check which one is set before you read the charts. Start with Source Type for the big picture, then switch to Source to compare individual channels.Company-wide
Click Dashboard in the top navigation and choose Source Effectiveness. It shows every job req in your account; use the Job Profile and Job Req controls to focus. It has three sheets: Effectiveness Analysis, Post-Hire Effectiveness and Exportable Data.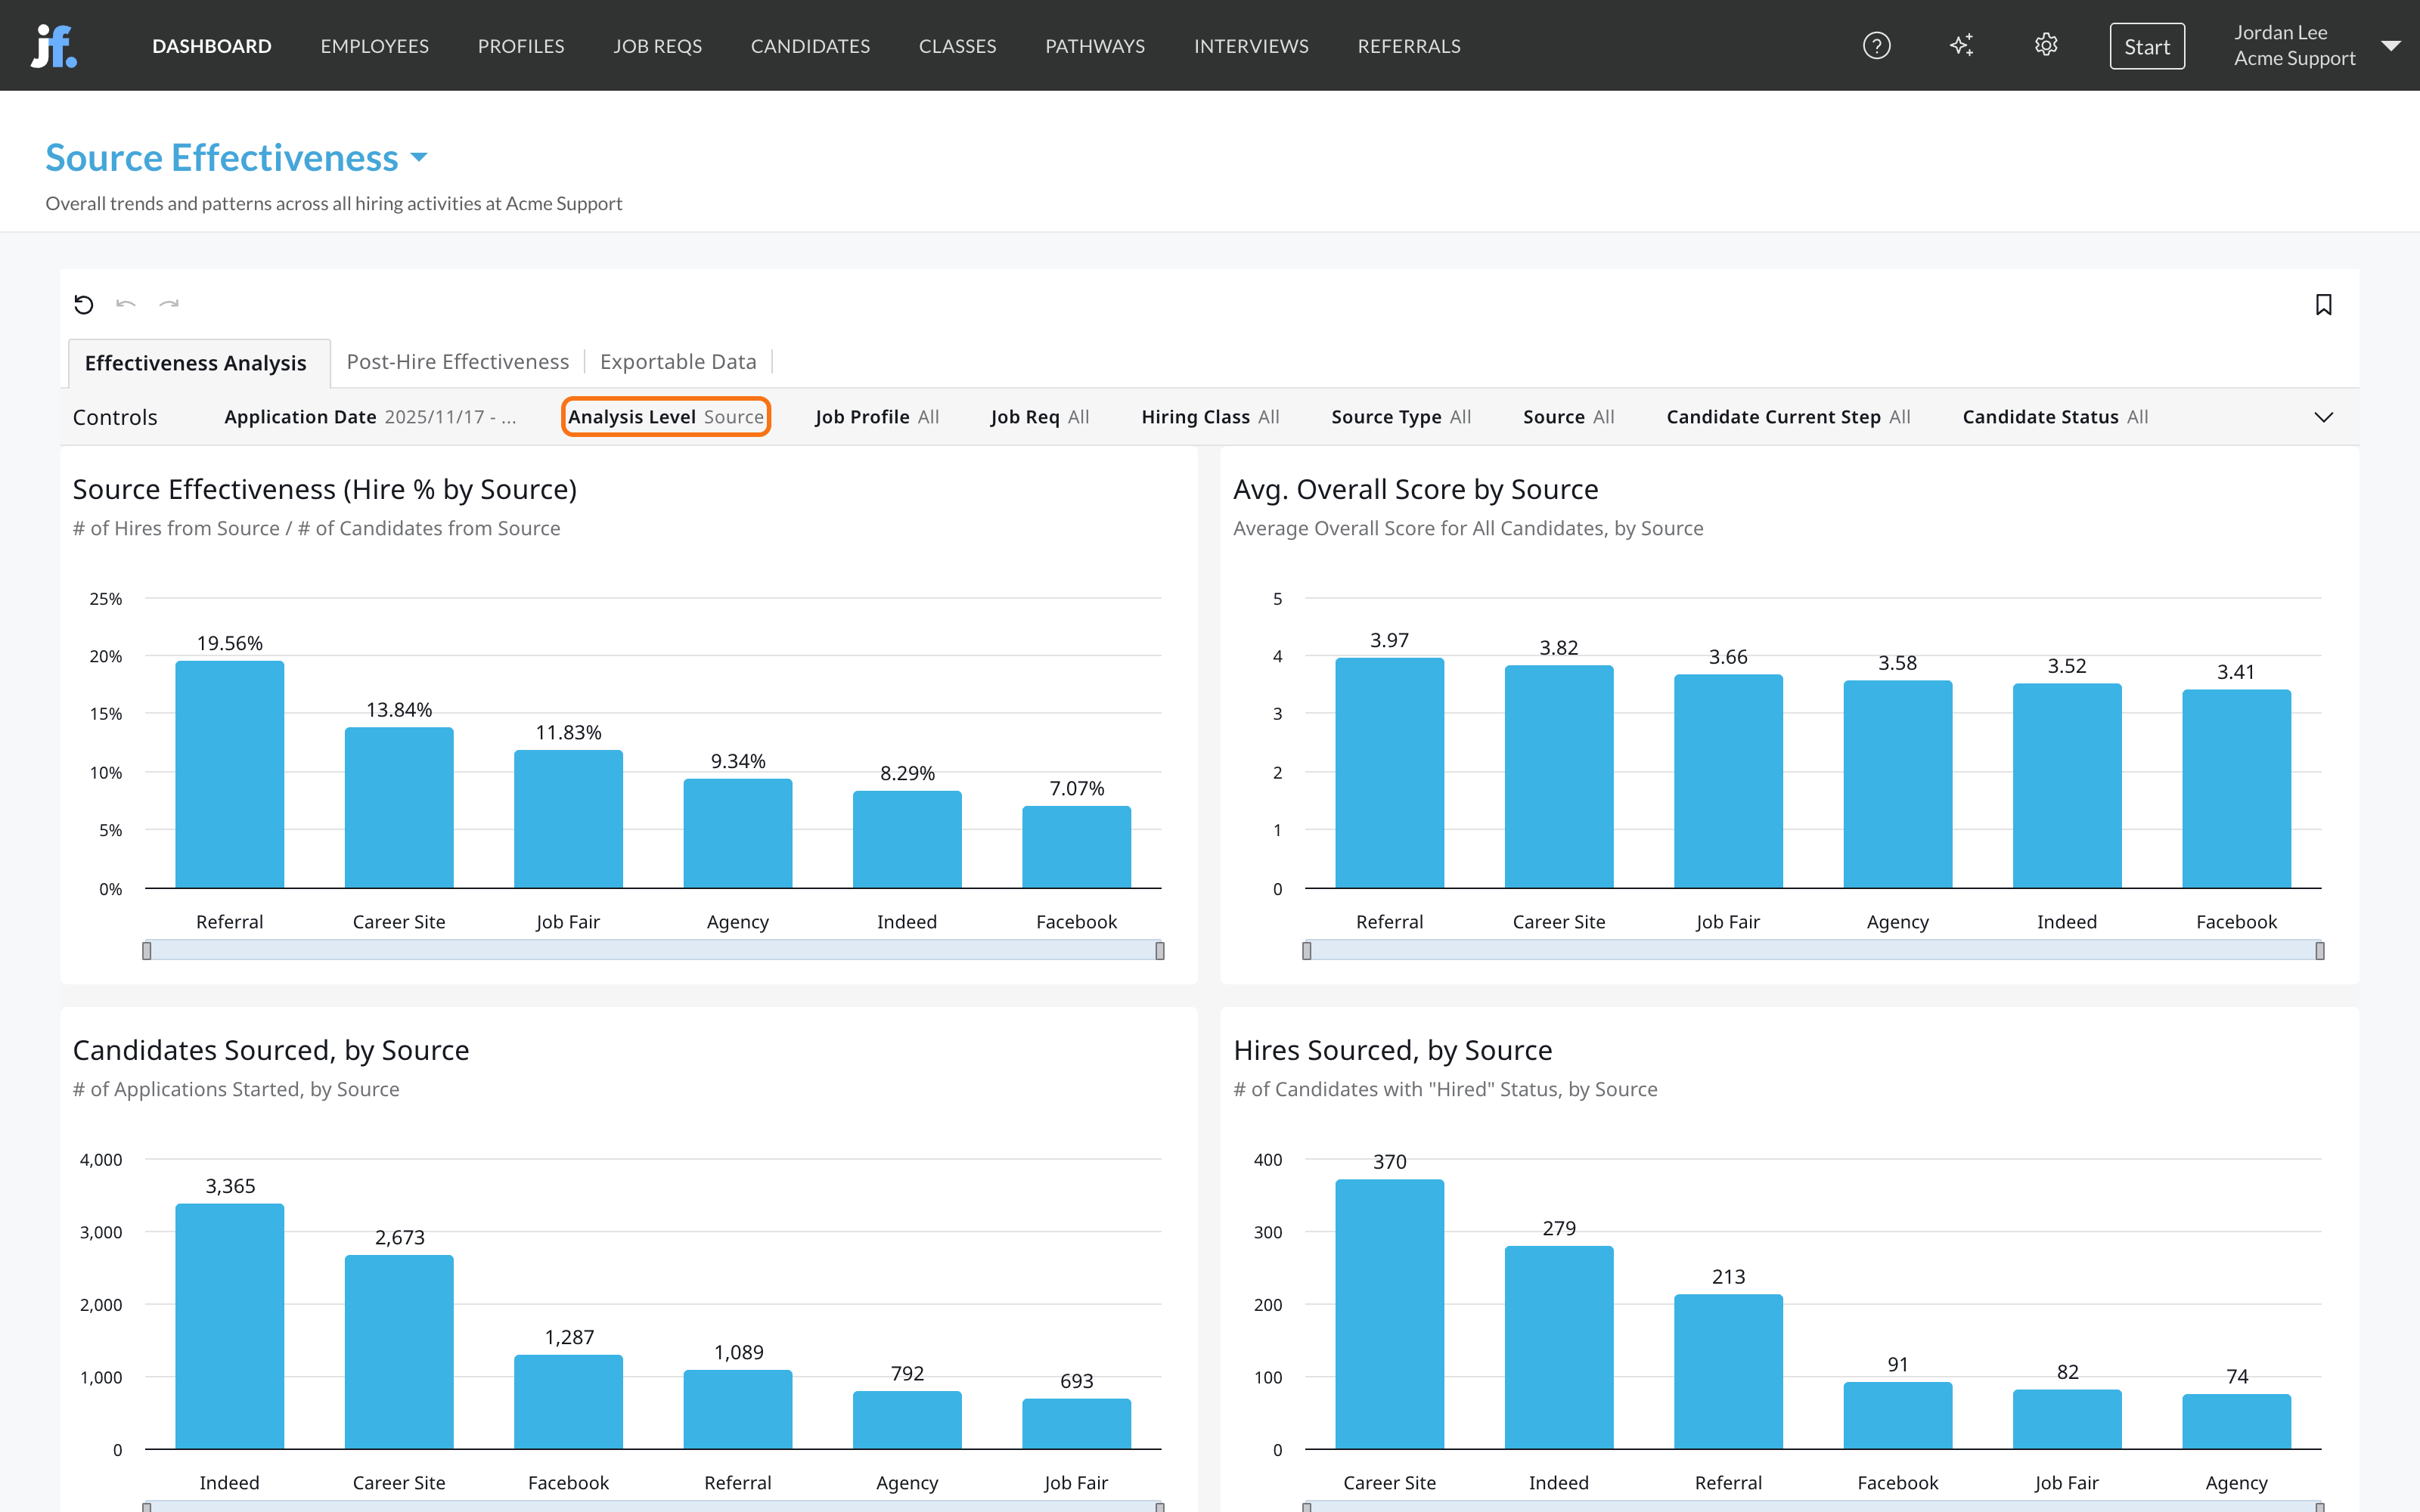
Effectiveness Analysis
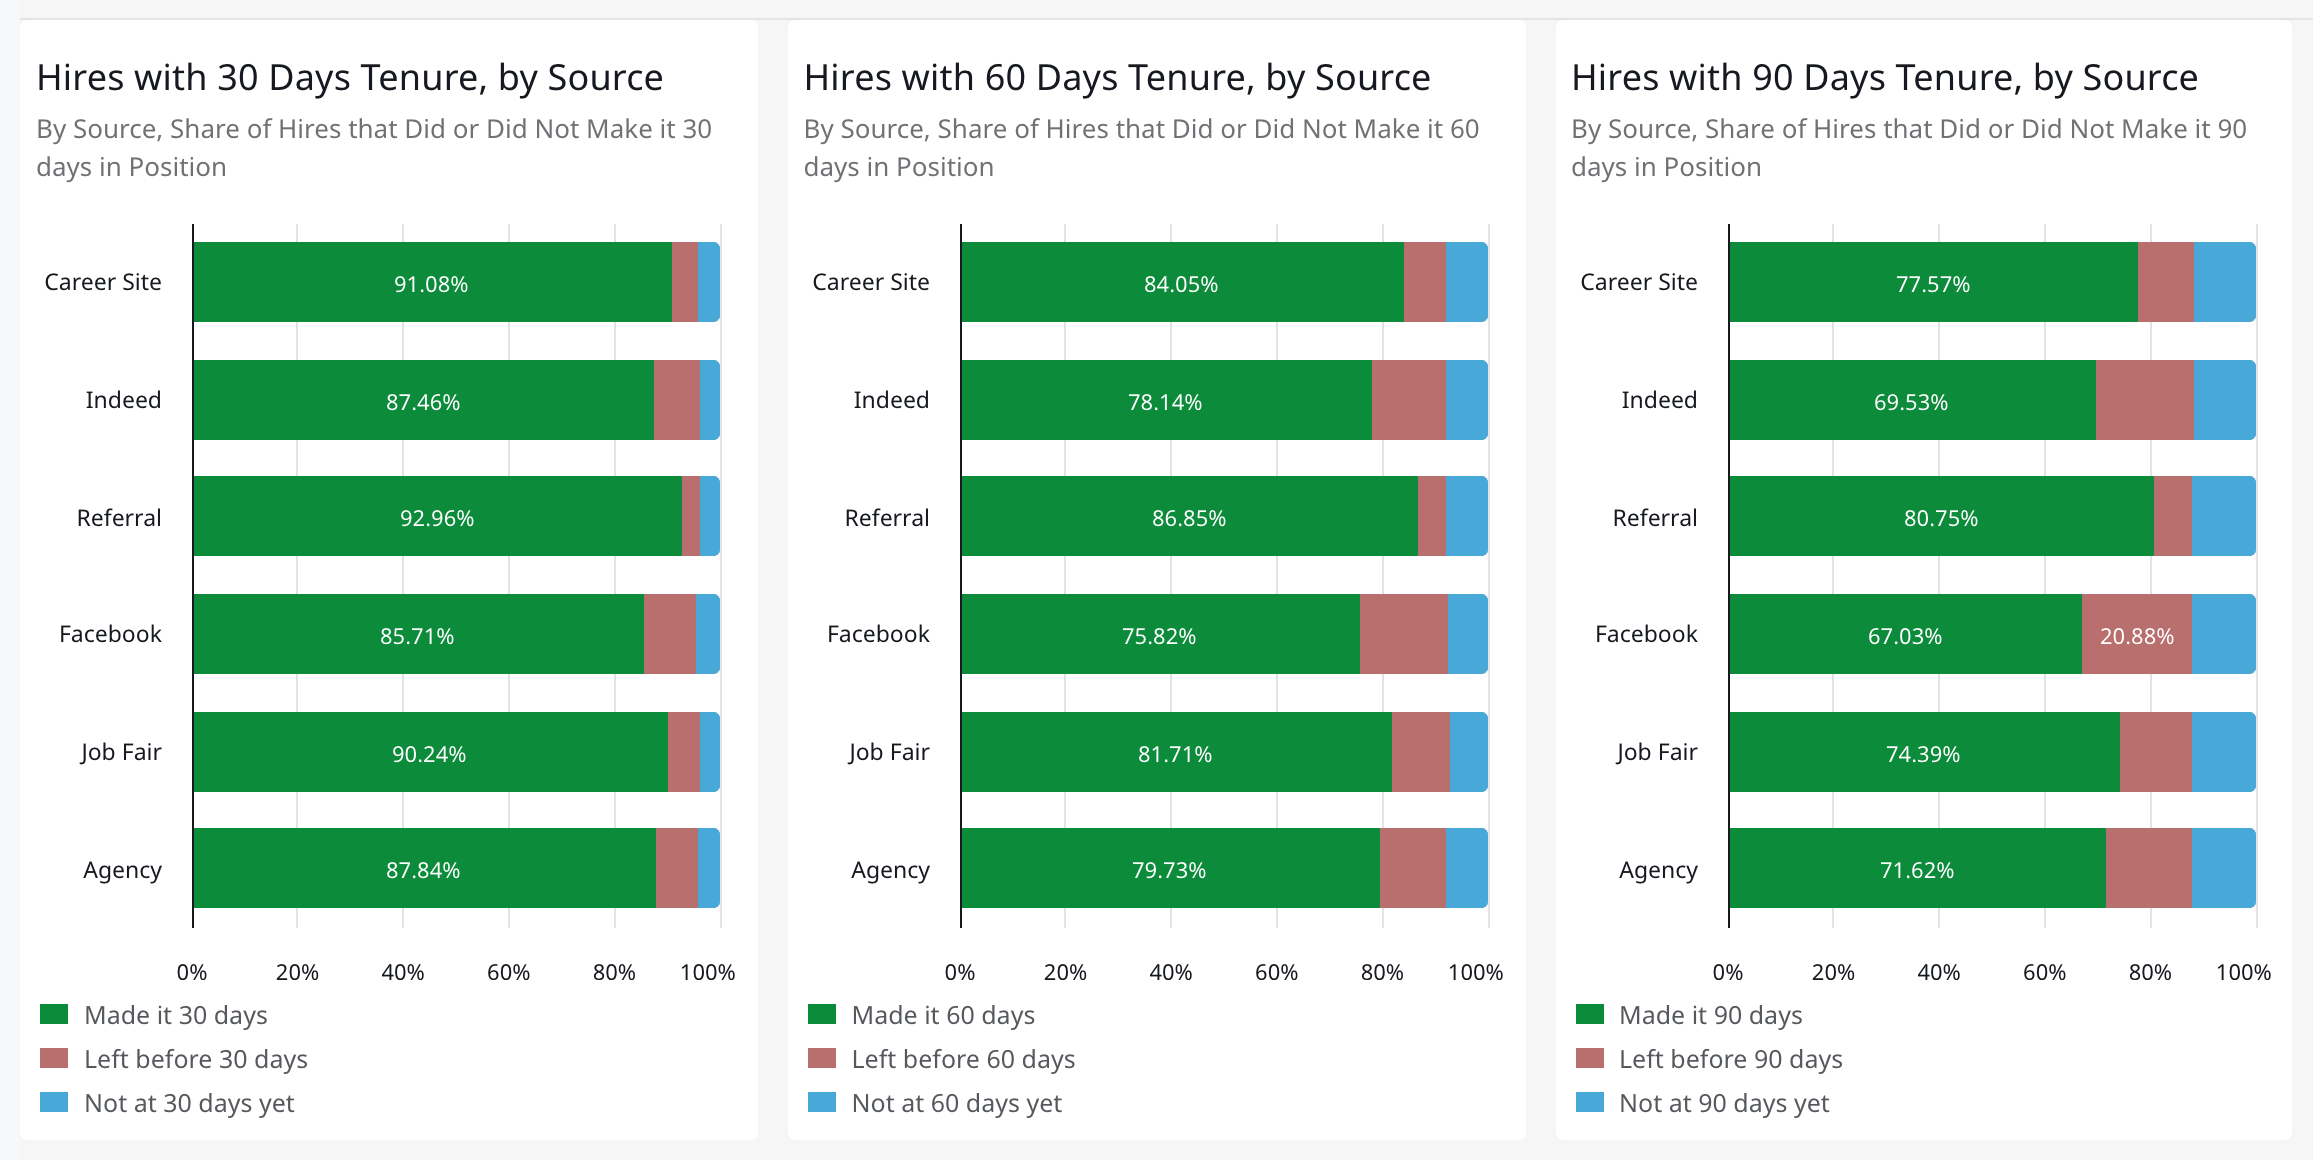
Post-Hire Effectiveness
This sheet follows hires from each source after they start. It needs employee data: start dates, end dates and performance results. See Quality of hire. Its date control is the hire’s Start Date.- Hires with 30 Days Tenure, by Source (and 60 days, 90 days and 6 months): the share of each source’s hires who made it that long, who left before, and who haven’t been there that long yet.
- Avg. Performance at 30 Days, by Source (and the other windows): how hires from each source were rated in that window.
- Avg. Score, by Outcome Attribute & Source: a heat map of performance results by source. Use the Time Between Start Date and Evaluation Date dropdown above it to pick the window.
Exportable Data
The Exportable Data sheet lays the numbers out as tables, such as each source’s candidates, average overall score, hires and hire percentage, and how many of each source’s candidates reached each step and completed each activity.For one job req
Open the job req, click its Dashboard tab, then Source Effectiveness. It has the Effectiveness Analysis and Exportable Data sheets, filtered to that job req. There’s no Post-Hire Effectiveness sheet on a job req; use the company dashboard with the Job Req control for that.How teams use it
- Judge channels by hires, not applicants. A source with lots of applicants and a low Hire % costs your recruiters time. A smaller source with a high hire rate and high scores may deserve more budget.
- Check who stays. Compare 90-day tenure by source on Post-Hire Effectiveness. A source whose hires leave early is more expensive than it looks.
- Look per location. The source mix often differs by site. Use by Location & Source before moving budget across your whole account.
- Clean up vague sources. If a large share of candidates has no source or a catch-all one, use magic links for every ad and post, and keep your source list short.
FAQ
Why are many candidates missing a source?
Why are many candidates missing a source?
Sources come from your links, your integrations and your team. Use magic links so every channel tags its applicants. See Sources.
Why is the Post-Hire Effectiveness sheet empty?
Why is the Post-Hire Effectiveness sheet empty?
It needs employee data: start dates, end dates for people who left, and performance results. See Quality of hire.
Related
Sources
How sources and source types work.
Magic links
Tag every applicant with where they came from.
Quality of hire
Turnover and performance by job profile.
Dashboards overview
Where dashboards live and how to filter them.