

Who can do this: The company Funnel Analytics dashboard needs Company Dashboard Access. A job req’s Funnel Analytics tab needs access to that job req.
Read it one job req at a time
Each job req has its own workflow, with its own step names and activities. When you look at many job reqs at once, steps from different workflows pile up and the funnel stops meaning much. Look at one job req at a time, or at a few job reqs that share the same workflow. There are two ways to do that:- On the job req: open the job req, click its Dashboard tab, then Funnel Analytics. It’s already filtered to that job req.
- On the company dashboard: pick the job req first, on the Job Reqs sheet or in the Job Req(s) control. Then read the other sheets.
Company-wide
Click Dashboard in the top navigation and choose Funnel Analytics. Like every company dashboard, it starts with data for every job req in your account.Pick a job req on the Job Reqs sheet
The dashboard opens on the Job Reqs sheet: a table of your job reqs with their job profile, Candidates, Candidates Interviewed and Hires. Click a row to select that job req for the rest of the dashboard, or choose it in the Job Req(s) control.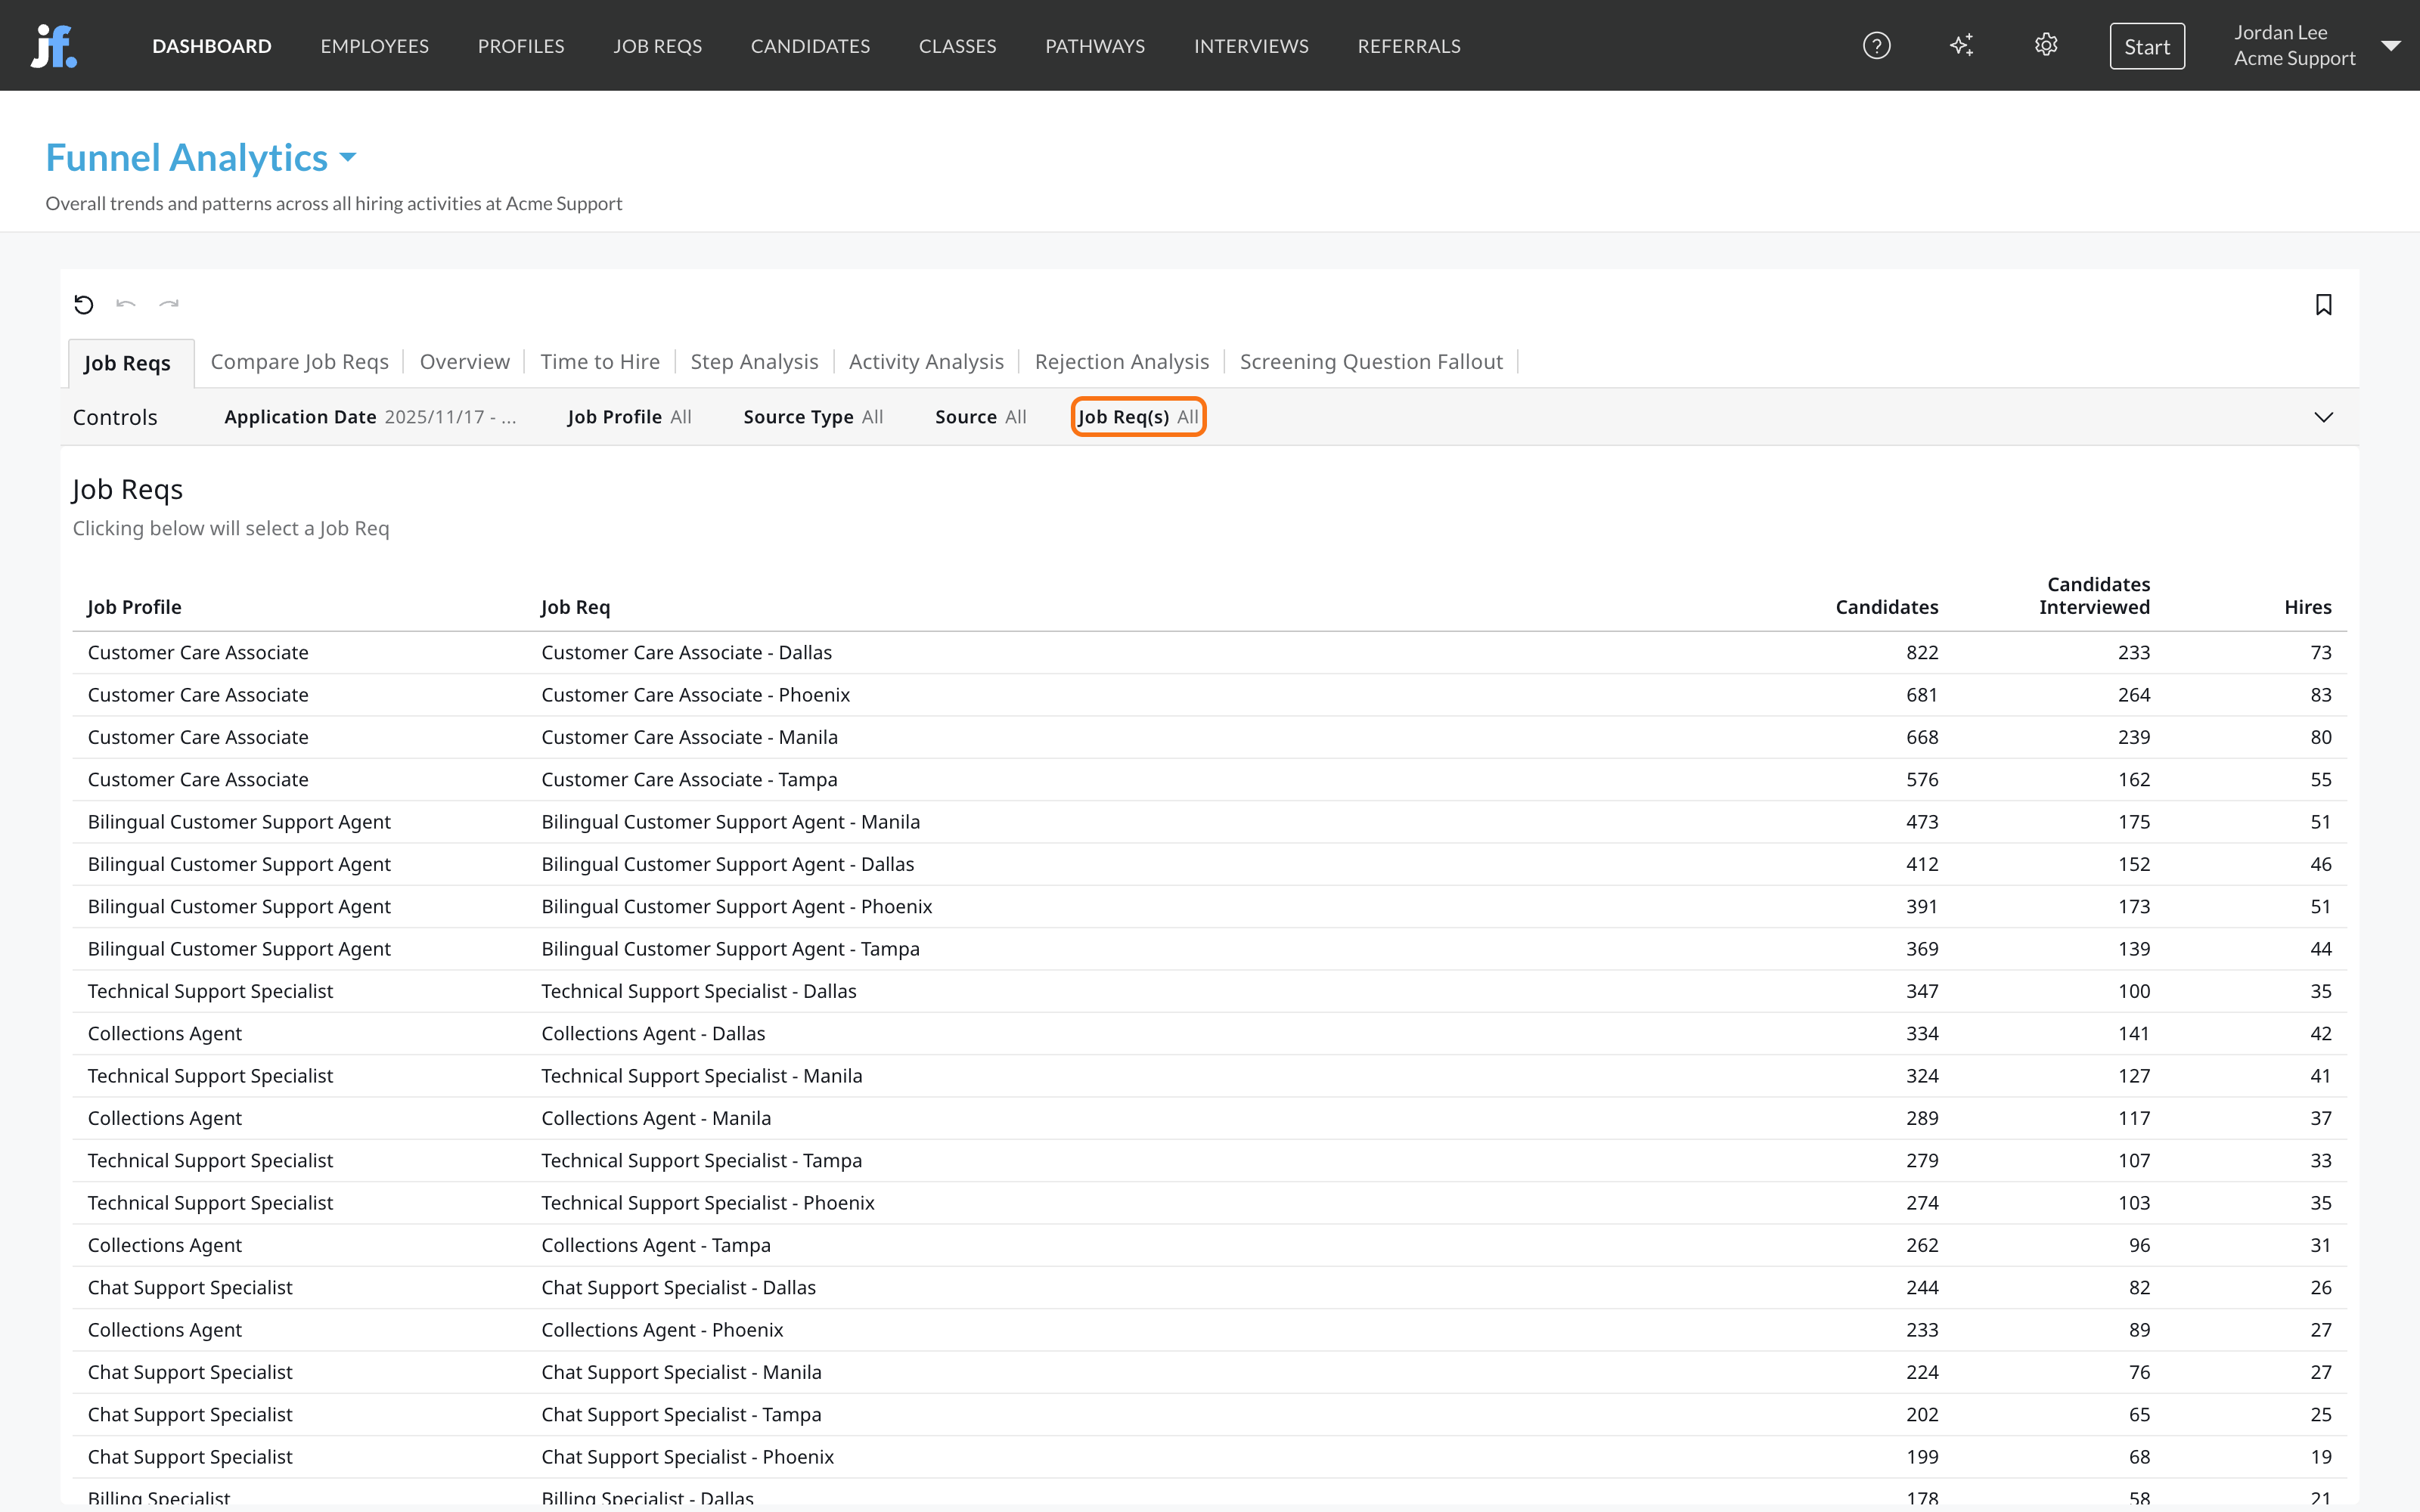
The sheets
The controls across the sheets include Application Date, Job Profile, Job Req(s), Final Result, Step, Step Result, Activity, Activity Status, Source Type, Source and Hiring Class.
The Overview sheet
The top of the Overview sheet has five headline numbers:
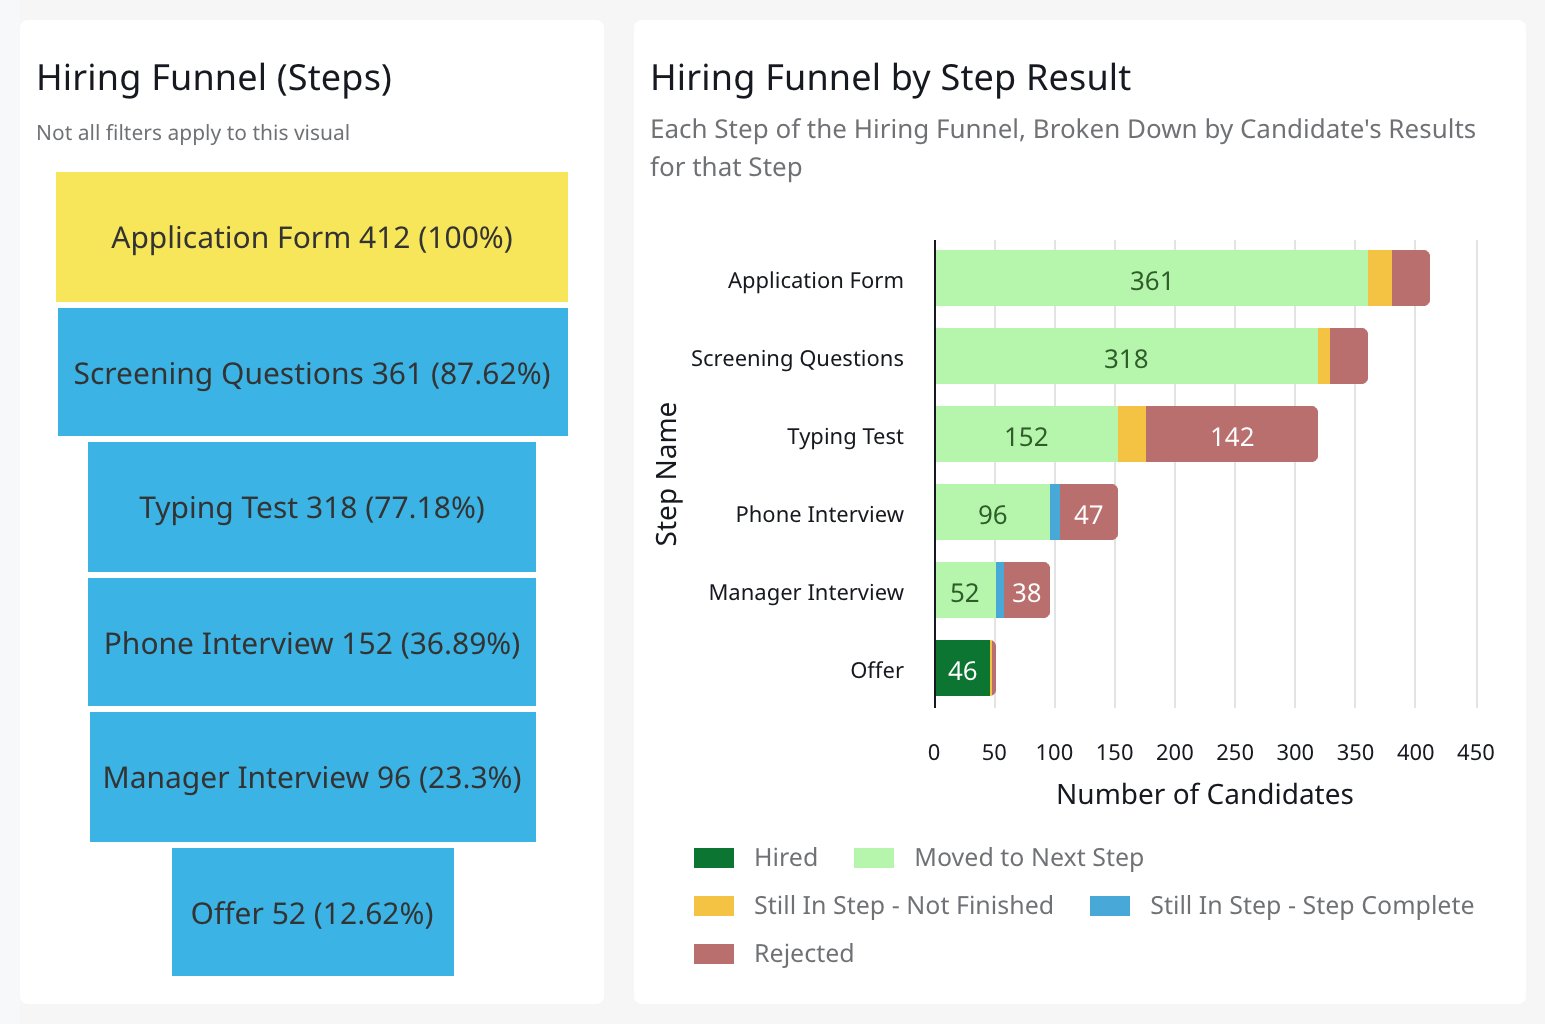
Below them are the funnels:
- Hiring Funnel (Steps): how many candidates reached each step, and what share of the first step that is.
- Hiring Funnel by Step Result: each step split by what happened to candidates there.
- Hiring Funnel (Completed Activities): the same funnel by activity, such as the application, an assessment or an interview.
- Hiring Funnel by Activity Status: each activity split into Complete, Complete - Need Scores, In Progress and Not Started.
Step results
Hiring Funnel by Step Result, the Step Analysis sheet and the Step Result control use these results:
Final Result describes the whole application instead: Hired, Rejected or Still in Funnel.
The Rejection Analysis sheet
Rejection Reason Distribution counts rejections by reason. Rejection Reason by Step shows the mix of reasons at each step, so you can see which reasons are used early in the process and which come later. Step Score Distribution and Activity Score by Final Result show whether rejected candidates really scored lower than the ones you hired.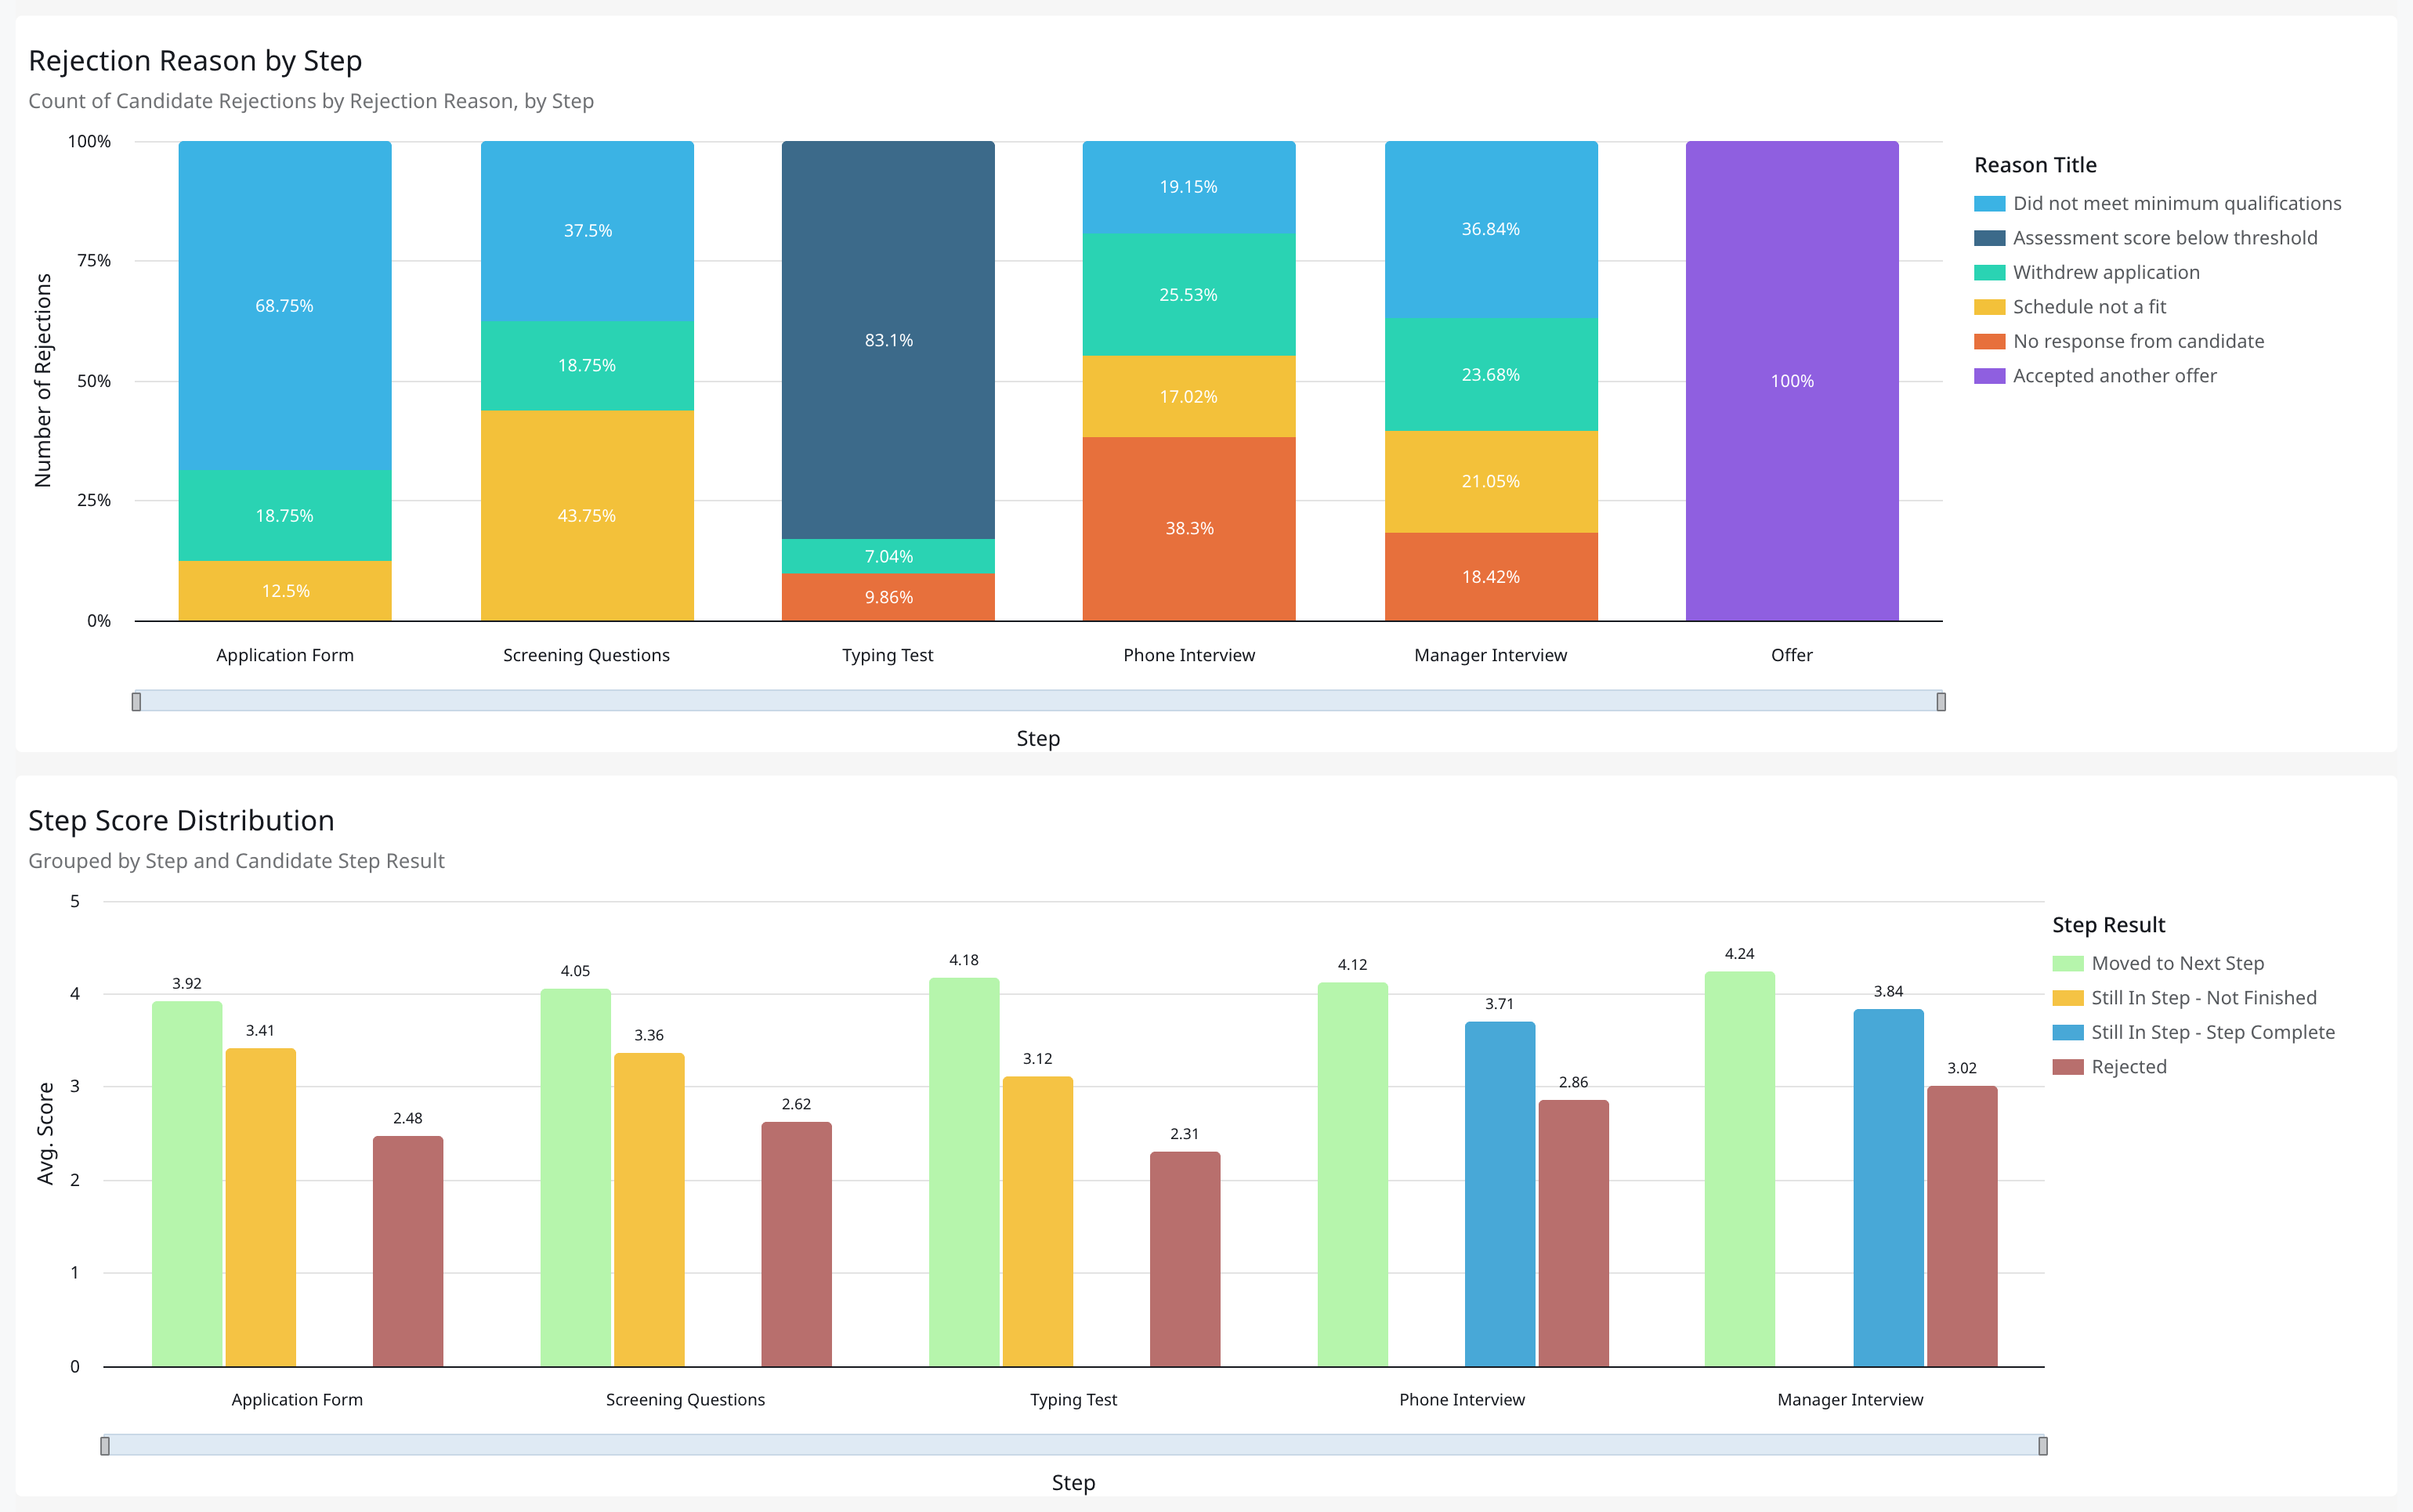
For one job req
Open the job req, click its Dashboard tab, then Funnel Analytics. It has the same sheets as the company dashboard except Job Reqs and Compare Job Reqs, and no job profile or job req controls. See Job req dashboards.Related numbers on Candidate Overview
The Candidate Overview dashboard adds the earliest drop-off: candidates who start the application but don’t finish it. Avg. Completion Rate Over Time shows how much of the application candidates complete on average, and the Incomplete slice of Candidate Status Distribution shows how many never submitted. See Applicant volume and pipeline.How teams use it
- Fix the biggest drop first. Find the step where the funnel narrows most. If candidates stall there rather than get rejected, shorten the step, add reminders or move it later in the process.
- Plan applicant volume. Candidates per Hire tells you how many applicants you need for each seat. If a hiring class needs 20 hires and the job req runs at 9 candidates per hire, you need about 180 applicants.
- Check unscored work. Complete - Need Scores on Hiring Funnel by Activity Status is work candidates finished that nobody has scored yet.
- Compare locations. Select the same role in several locations on Compare Job Reqs to see which site loses more candidates, and at which step.
FAQ
Why does the funnel look messy with every job req selected?
Why does the funnel look messy with every job req selected?
Each job req’s workflow has its own step names, so a funnel across many job reqs mixes steps that don’t line up. Pick one job req, or a few with the same workflow.
Why don't the step counts match the Candidates page?
Why don't the step counts match the Candidates page?
The dashboard counts candidates who applied in the Application Date range and reached each step. The Candidates page shows where candidates are right now. Match the date range before comparing.
Related
Time to hire
How long hiring takes, and which step slows it down.
Screening question analytics
The questions candidates stop at.
Rejection and separation reasons
Keep your rejection reasons clear so this report reads well.
Dashboards overview
Where dashboards live and how to filter them.