

Who can do this: The company Candidate Overview and Hiring Classes dashboards need Company Dashboard Access. A job req’s Overview tab needs access to that job req.
Company-wide: Candidate Overview
Click Dashboard in the top navigation. It opens on Candidate Overview, which covers every job req in your account. It has two sheets: Summary and Job Req Detail. Both count candidates by Application Date, the date they started the application.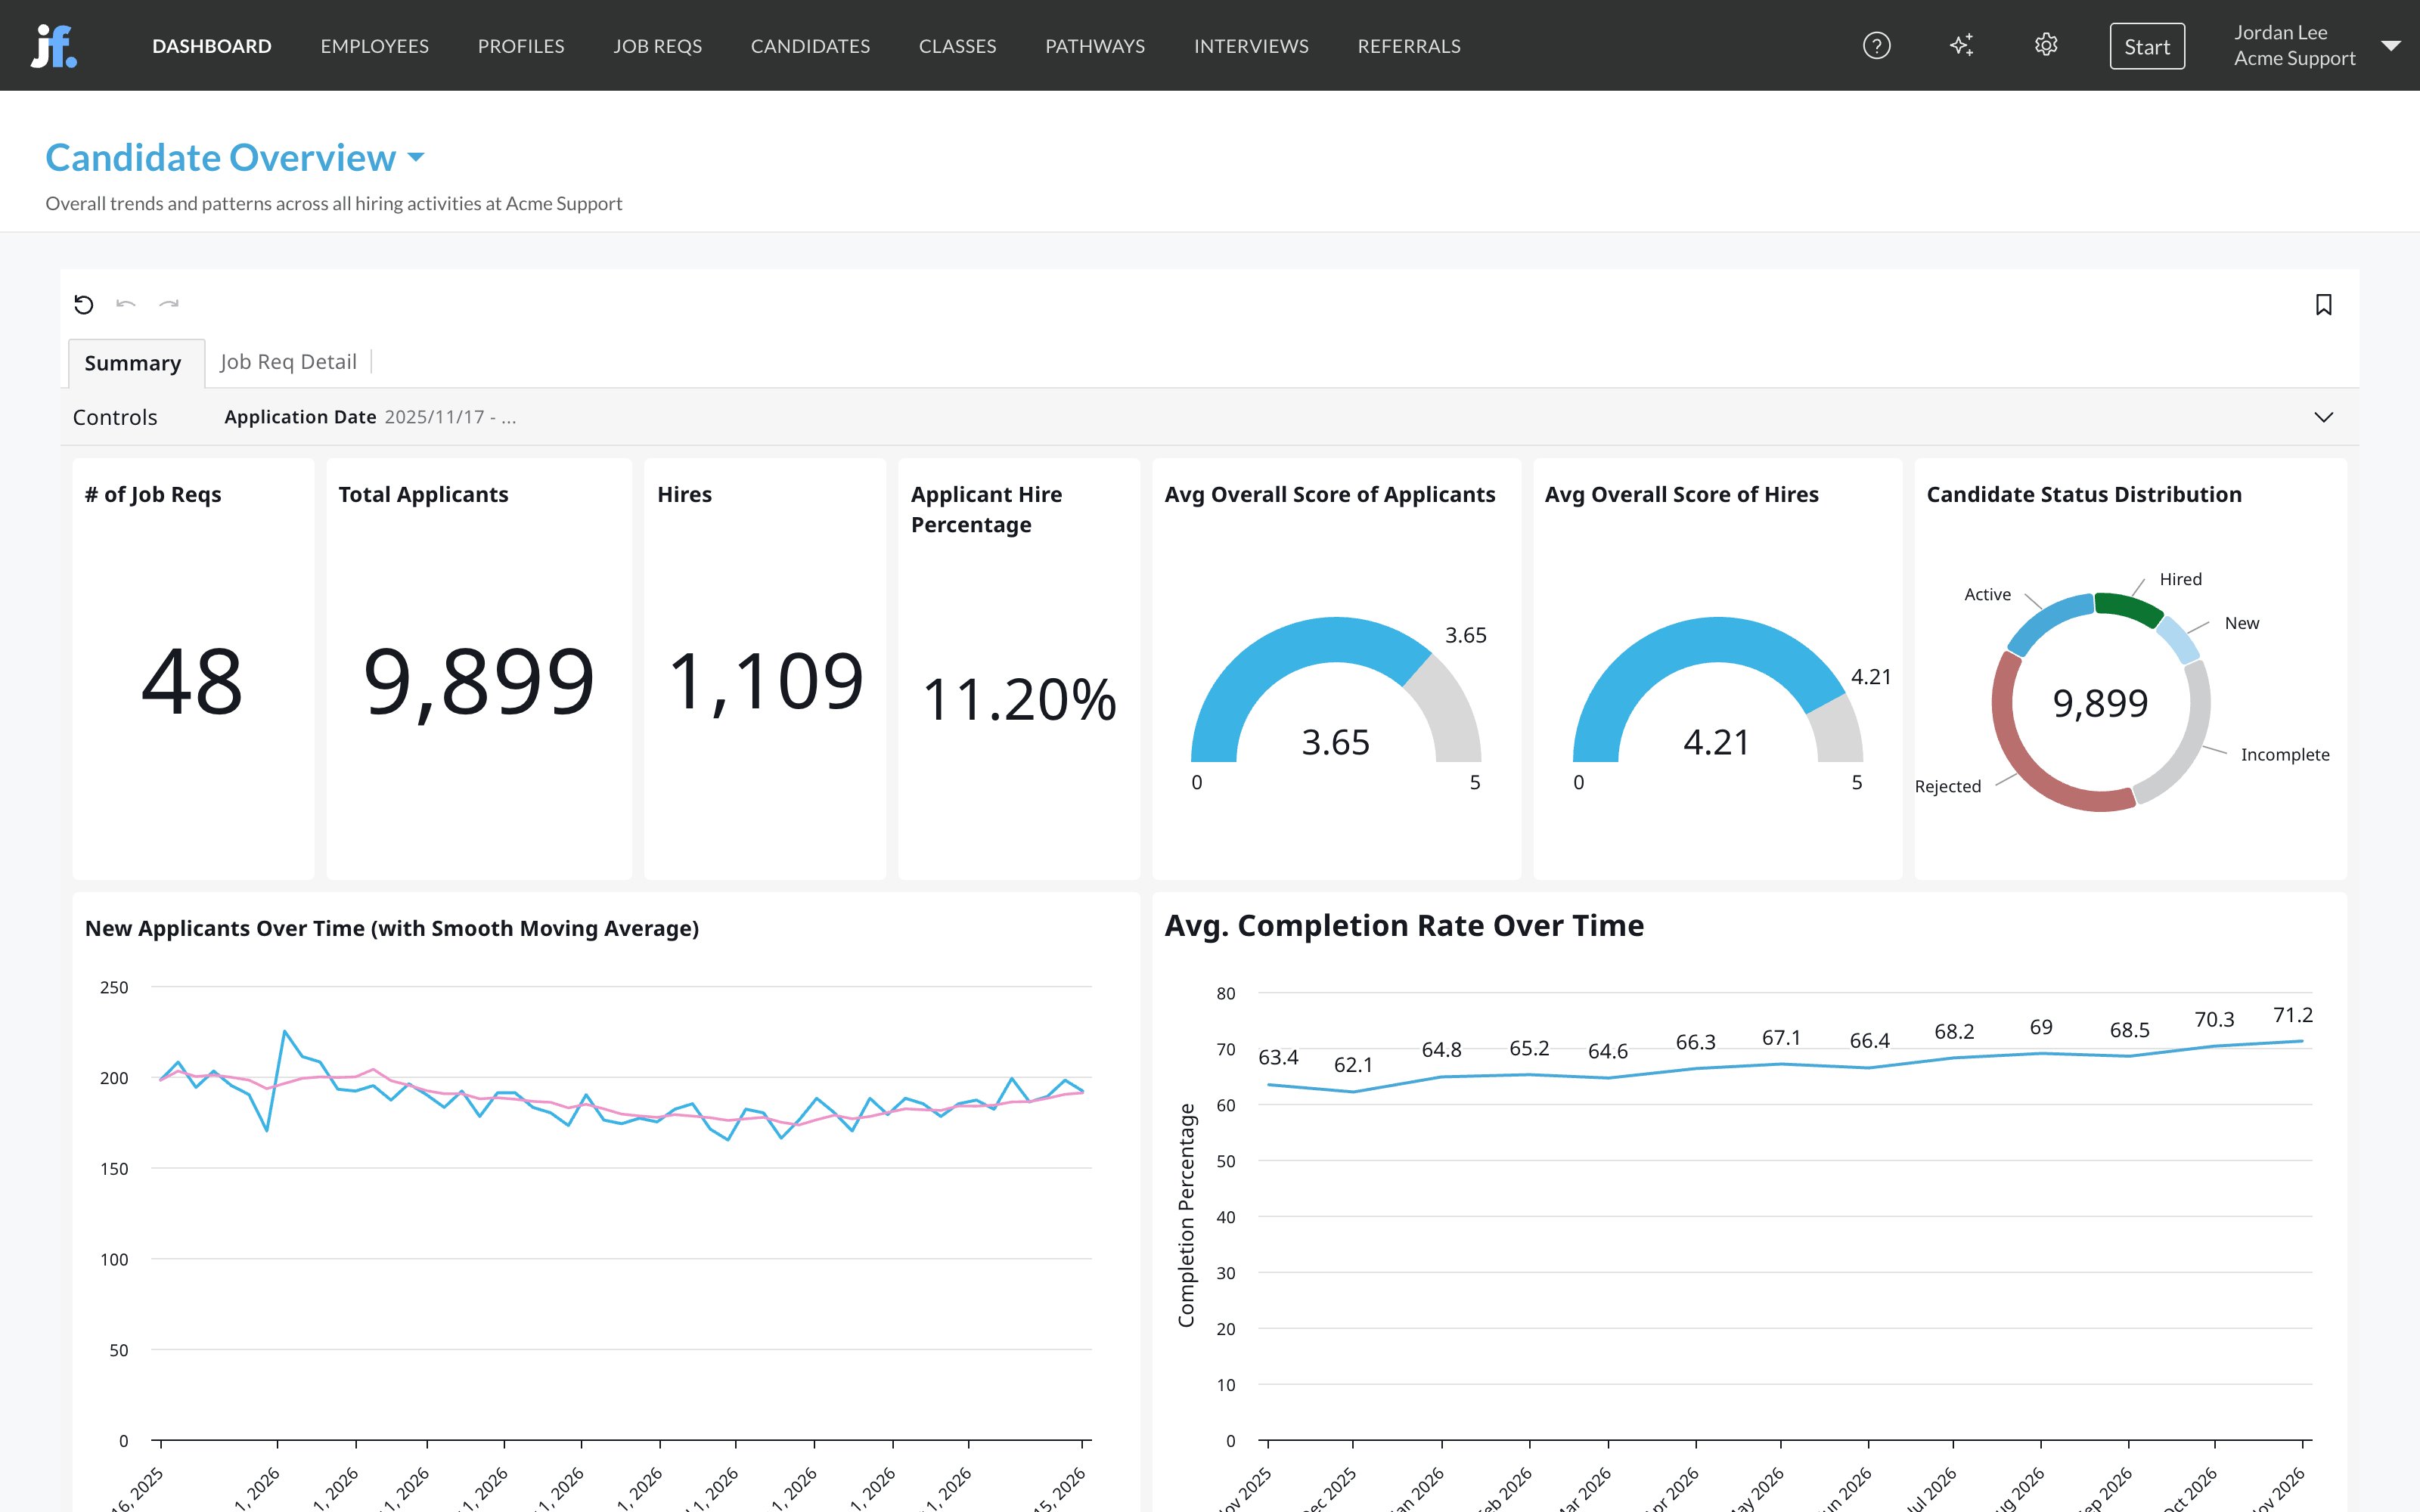
The Summary sheet
The Job Req Detail sheet
The same headline numbers, plus a breakdown by job req. Its controls include Job Profile, Job Req, Hiring Class, Candidate Status, Source Type and the candidate’s location.- Candidates by Job Req and Candidates Over Time by Job Req: which job reqs draw the most applicants.
- Completion Rates Distribution Over Time: the share of applicants at each level of application completion, by month, from red (barely started) to green (finished).
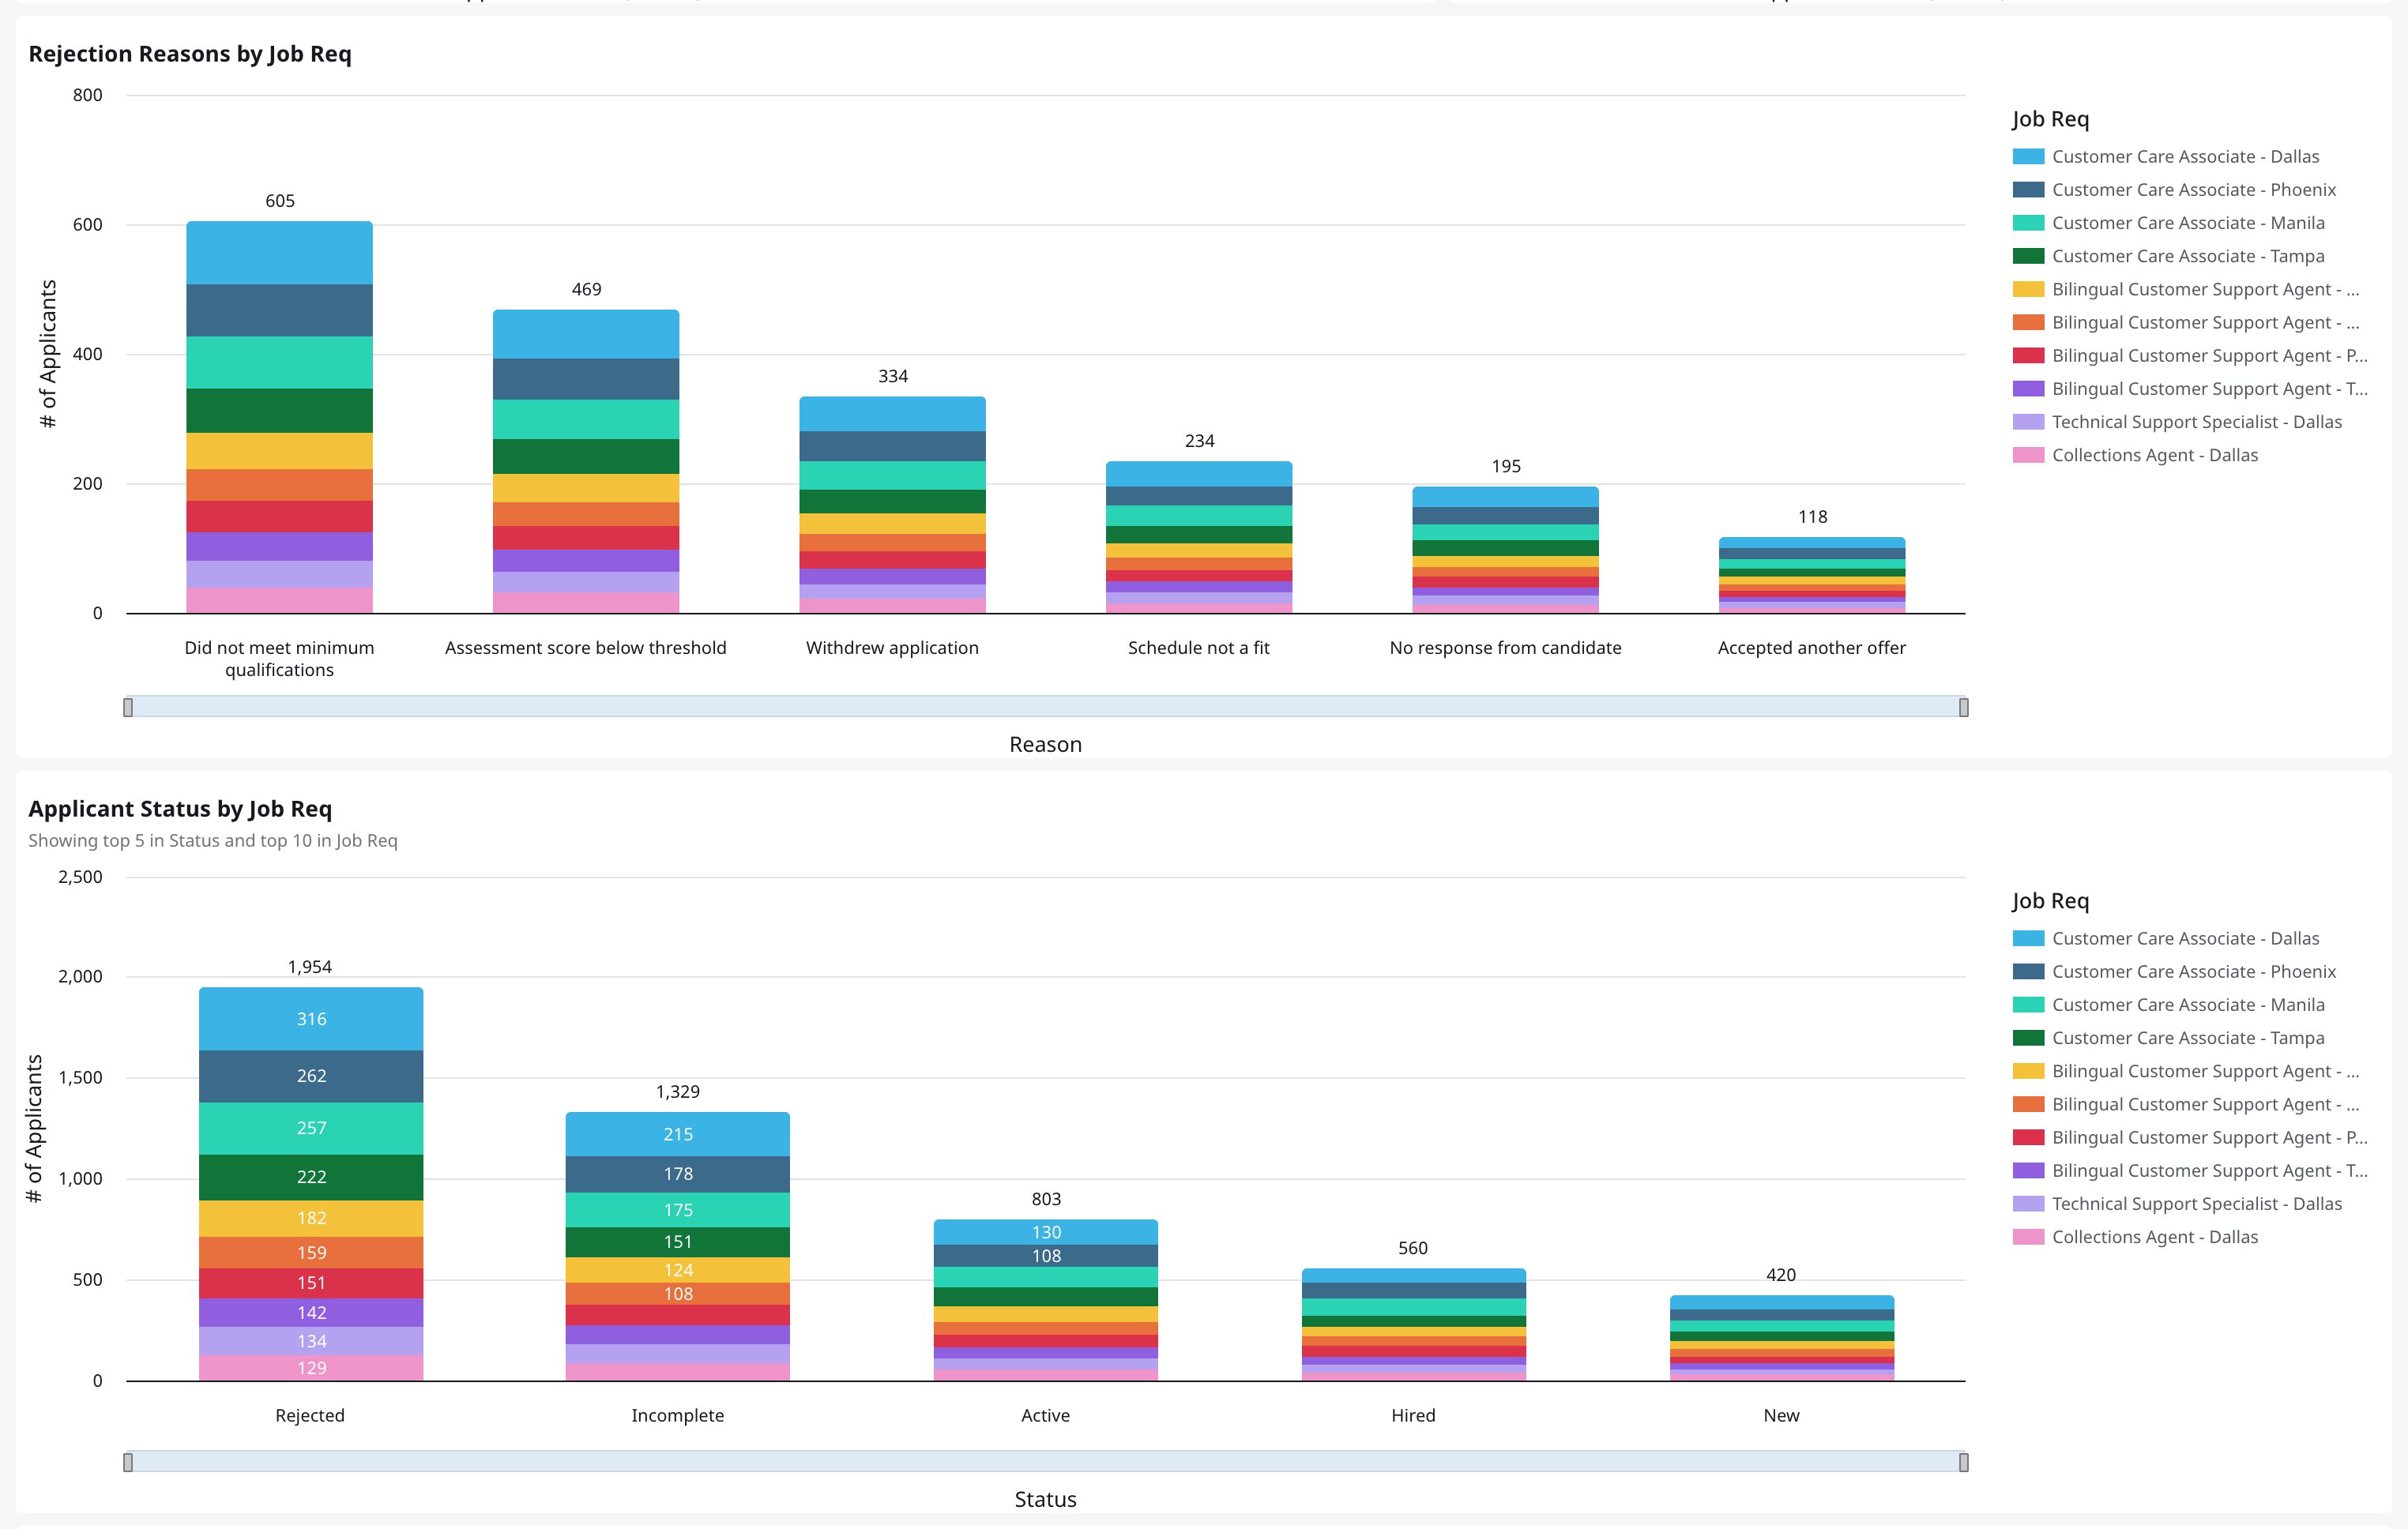
- Rejection Reasons by Job Req and Applicant Status by Job Req: which job reqs drive each rejection reason, and where the incomplete and active applications sit.
For one job req
Open the job req and click its Dashboard tab. It opens on Overview: the same kind of view for that job req, with total applicants, new applicants over time and applicants by status. See Job req dashboards.Hiring Classes
If you hire in classes, the Hiring Classes dashboard shows whether they start full. Choose Hiring Classes from the Dashboard menu. It counts by New Hire Start Date, and other controls include Job Profile, Job Req, Hiring Class Name, Hiring Class Job Title and Hiring Class Status.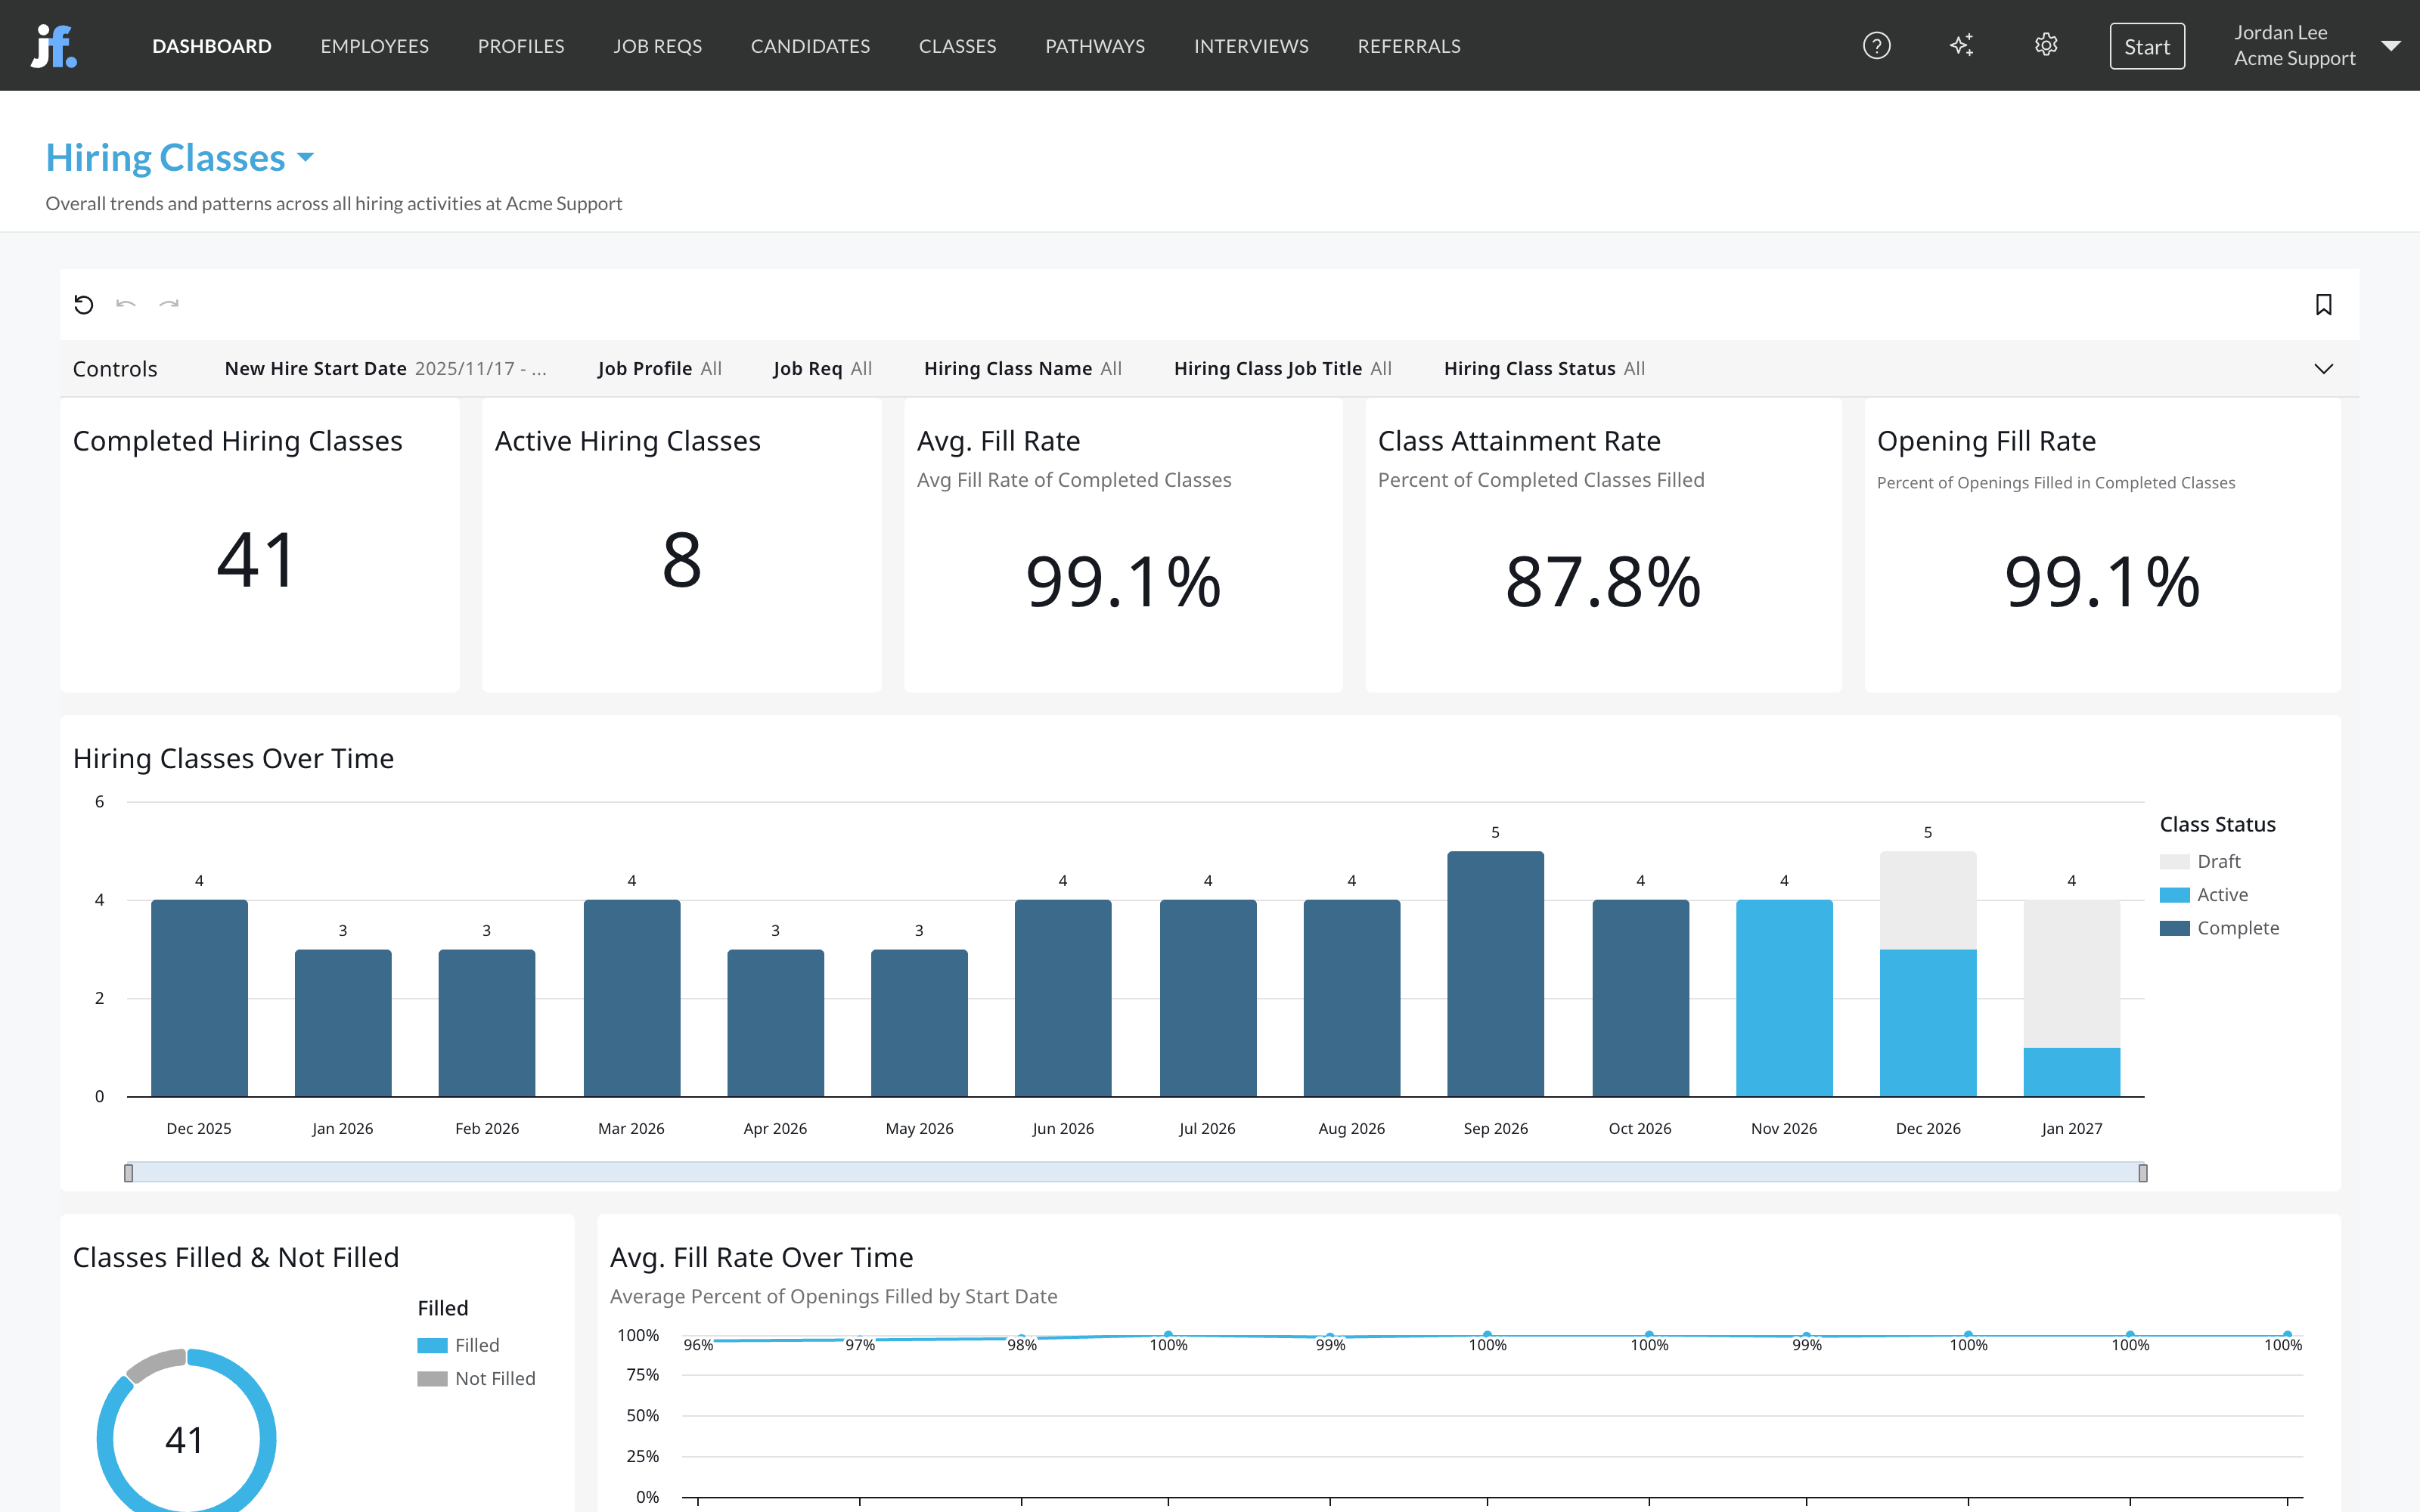
See Hiring classes.
How teams use it
- Watch volume weekly. New Applicants Over Time is your early warning. A drop shows up here weeks before it shows up in hires.
- Find abandoned applications. A growing Incomplete slice, or a falling Avg. Completion Rate Over Time, means candidates give up partway through. Shorten the application or move questions later. See Funnel and drop-off.
- Learn what a good score is. Overall Score Distribution shows where most applicants land on your account. Use it to set review thresholds and automation rules that fit your real pool.
- Plan classes from the gap. Hiring Class Detail shows which classes are short and by how many. Pair it with Candidates per Hire on Funnel Analytics to see how many more applicants you need.
Related
Funnel and drop-off
Where candidates leave your process.
Hiring classes
Group hires who start together.
Source effectiveness
Where your applicants come from.
Dashboards overview
Where dashboards live and how to filter them.