Using Dashboards
- Sign in at https://app.journeyfront.com/login
- Click the “Dashboard" tab in the top navigation bar

- Click the name of the current dashboard (Candidate Overview) to see a list of other dashboards
- Select "Hiring Process Fidelity" from the menu

- Select "Hiring Process Fidelity" from the menu
- There is only one tab in the Hiring Process Fidelity dashboard, so it will be selected by default
Hiring Process Fidelity
Activity Completion Rates for hires
- Use the controls at the top of the dashboard to narrow your search. By clicking on 'Controls’ or the dropdown arrow will open the control panel


- Employee Start Date - Define the dates you would like to see
- Job Profile - Job types to be included
- Location - Cities/Countries to be included
- Job Status - The job’s status (archived, active, etc.)
- Job Req - Specific job requisitions to be included
- Source Type - The type of origin or channel through which the candidate began applying to the job (eg. Social media, Job Board)
- Source - The specific origin or channel through which the candidate learned about and applied for the job (eg. Facebook, Referral)
- Activity Name - The name of the activity completed
- Assigned User - Hiring personnel or team member that is currently assigned to the candidate
- Click on the word "Controls" or on the dropdown arrow to close the control panel
- The first set of visuals on this page are various KPIs
- Percent of all Activities Complete - For all hires, what percent of hiring activities were completed*
- Total Candidates Hired - The number of hired candidates considered in the above percentage
- Percent of Activities Complete by Location - This table shows summarized data by location. Clicking on locations will open up more detailed info
- *This includes activities in steps that candidates were never dispositioned to. If a candidate completes an interview in a step, all interviews in that step are considered completed

- *This includes activities in steps that candidates were never dispositioned to. If a candidate completes an interview in a step, all interviews in that step are considered completed
- On this visual you also can drill down at the Job Req level to see individual hires for more details on why % complete is down in areas and complete audits when necessary.

- Scroll down. This will reveal another visual.
- Percent of Activities Complete by Activity & Location - Each activity across the x-axis, and a completion percentage on the Y-axis, with color representing by job req

- Percent of Activities Complete by Activity & Location - Each activity across the x-axis, and a completion percentage on the Y-axis, with color representing by job req
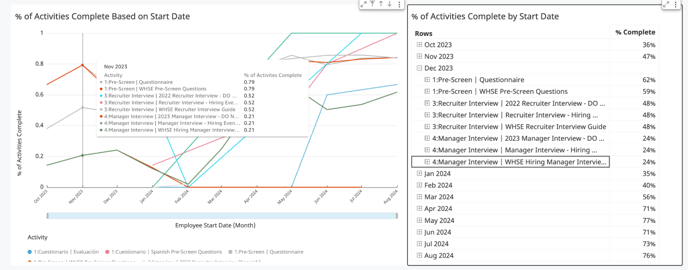
- Scrolling down again will reveal another large visual. This next graph shows how many activities are being completed. Hovering will allow drilling between date granularities (Day, Month, Quarter, etc.)

- Scrolling down will show one final pair of visuals. On the left is a more detailed line chart, similar to the above. Instead of one line for all activities, it has lines representing each activity’s completion rate over time. On the right is the data for this visual, for further analysis