Activity Effectiveness
- Sign in at https://app.journeyfront.com/login
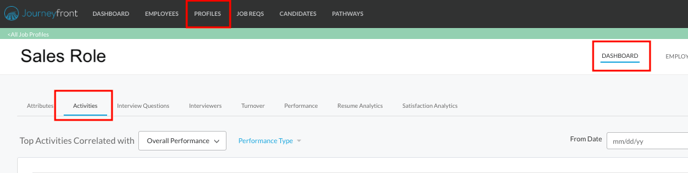
- Click "PROFILES" tab on the top navigation bar
- Select the profile you want to view, and go to the Dashboard page
- On the Dashboard page, select "Activities" from the menu
- Use the following controls to specify the data you want to see
- Performance or Retention - select which outcome you'd like to view
- Performance or Separation Type - you may view all types or just select a few
- Date - choose the date range for the dashboard
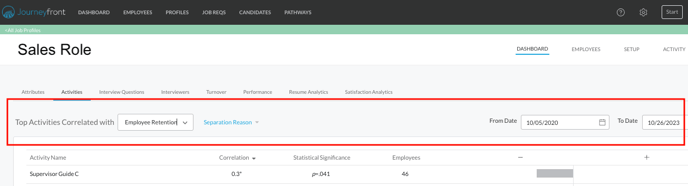
- After you adjust the controls, the data will load in the dashboard as shown below
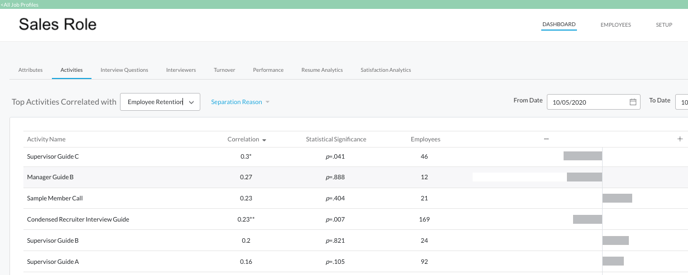
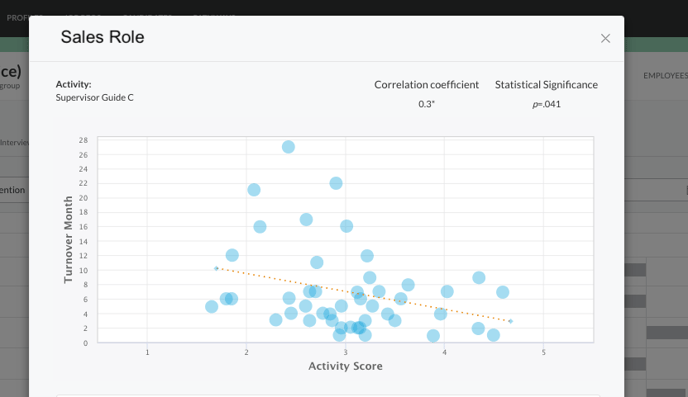
- Next to each activity, the correlation, statistical significance, and number of employees are listed
- To learn more about the activity, click on the graph icon to the very right of the activity
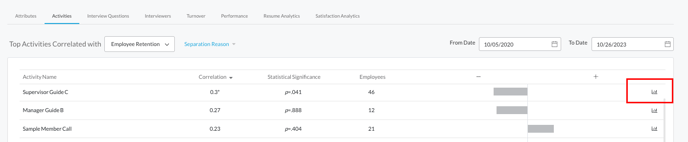
- A screen will appear showing the graph with the outcome and activity score as data points
- Scroll to see a list of employees who make up this graph
- For any additional questions, please contact your customer success manager